
Electrical Technology
Get started today
About Electrical Technology
Electrical Technology provides the opportunity to acquire the theory and skills needed to gain entry-level employment and advancement at an accelerated pace in the electrical field. Students will be able to apply basic electrical theory to all aspects of electrical technology. Skills and safe working habits are developed through construction and maintenance work project assignments. Since electricity has become an integral part of everyday life, an adequate supply of electrical power is necessary, as well as a reliable system for efficient utilization; thus, there is a continuing need for qualified electrical technicians.
Graduates’ knowledge and skills are useful in such career areas as electrical engineering technicians, power plant technicians, electrical construction, industrial maintenance, and as technical representatives. High school prerequisites for this program are Algebra I & II, and a GPA of at least 2.5.
What you’ll learn
- Demonstrate technical skills in a variety of electrical fields, apply these skills to new developments in these fields, and apply accepted safety standards.
- Demonstrate the ability to design, develop, and analyze electrical circuits and systems.
- Complete parts lists and order forms that demonstrate knowledge of catalogs and of coding and numbering systems for devices, hardware, and materials.
- Interpret and develop blueprints, schematic diagrams, and wiring plans and transform them into functioning projects that conform to the National Electrical Code and/or other specifications.
- Evaluate electrical circuits and systems and communicate the results of such evaluations verbally or in writing.
- Demonstrate basic knowledge of construction procedures and electrical wiring techniques.
- Demonstrate knowledge of the use of test equipment and the electrical theory
Sample Job Titles
Chief Electrician; Control Electrician; Electrician; Industrial Electrician; Inside Wireman; Journeyman Electrician; Journeyman Wireman; Maintenance Electrician; Mechanical Trades Specialist, Electrician; Qualified Craft Worker, Electrician (QCW, Electrician)
Quick facts
Location
Snyder Building, Main Campus; Second-Year, Woolworth Building, Main Campus
Type of program
Associate Degree
Job/Salary Outlook
See industry data
Length of program
2 years, 74 credits
Cost of program
$4,500/semester tuition
$3,000 – $3,500/semester housing
$1,850 – $2,335/semester meal plan
Tool List (PDF)

The outcomes speak for themselves
Graduates’ knowledge and skills are useful in such career areas as electrical engineering technicians, power plant technicians, electrical construction, industrial maintenance, and as technical representatives.
96.8%
employment
$70K
med. salary
People of TSCT
Success stories
Program details
Courses
MODEL SCHEDULE FOR ELECTRICAL TECHNOLOGY
Semester 1
- ELEC 107 Theory and Analysis Lab I (1 credit)
- ELEC 113 Theory and Analysis I (4 credits)
- ELEC 117 Practicum (4 credits)
- ELEC 120 Systems Design I (3 credits)
- MATH 137 Intermediate Algebra (or higher) (3 credits)
- ENG 106 Composition I (3 credits)
Semester 2
- ELEC 126 Systems Design II (3 credits)
- ELEC 157 Theory and Analysis lab II (1 credit)
- ELEC 162 Theory and Analysis II (4 credits)
- ELEC 168 Practicum II (4 credits)
- ENG 216 Technical Writing (3 credits)
- MATH 141 Trigonometry (or higher) (3 credits)
Semester 3
- ELEC 211 Industrial Electronics (4 credits)
- ELEC 216 D.C. & A.C. Motors and Generators (4 credits)
- ELEC 257 Industrial Motor Control (4 credits)
- PHYS 213 General Physics I (4 credits)
- CIS 111 Intro to Computer Applications (3 credits)
Semester 4
- ELEC 206 Industrial Electricity (4 credits)
- ELEC 263 Advanced Industrial Motor & Drive Control (4 credits)
- ELEC 267 Programmable Logic Controllers (4 credits)
- Humanities Elective (3 credits)
Additional General Education Requirements
- HEAL Elective HEAL 106 or HEAL 111 (1 credit)
- Elective General Studies Elective (3 credits)
Total Credits 74
Faculty
Occupational Advisory Committee
The Occupational Advisory Committee (OAC) serves as a vital link between the Program of study and industry, ensuring that the program remains aligned with current workforce needs, technological advancements, and best practices in the field. Composed of employers, educators, and other community members, the committee provides guidance, feedback, and recommendations to enhance the curriculum, instructional methods, and student learning experiences.
Purpose and Responsibilities:
- Curriculum & Industry Alignment
- Workforce Readiness
- Student & Faculty Support
- Internship & Employment Connections
- Accreditation & Program Evaluation
- Facilities & Equipment Recommendations
By fostering a strong relationship between academia and industry, the OAC helps ensure that Thaddeus Stevens College programs maintain the highest standards in CTE (career and technical education).
- Chris Bair, Tri-M Group
- Ray Buckwalter, Associated Building Inspectors (ABI)
- Ed Bernitsky, IBEW LU 743
- Bill Beyer, Campbells Snacks/Pepperidge Farm
- Randy Blair, Heat and Control
- Ray Buckwalter, Associated Building Inspectors
- Felix DeJesus, Armstrong World Industries
- Justin Fisher, Americold
- Bobby Helsel, III, Tri-M Group
- Alexandra Hickey, Hershey/Y&S Candies
- Dennis Knepper, PPL Corp.
- Kevin Phipps, Tri-M Group
- Steven Schriver, Shingle & Gibb Automation
- Kurt Suchar, Schaedler Yesco
- Greg Weikel, Swartley Bros. Engineers, Inc.
- Christian Wise, Cargill
Essential Skills Learned
Tasks
- Plan layout and installation of electrical wiring, equipment, or fixtures, based on job specifications and local codes.
- Connect wires to circuit breakers, transformers, or other components.
- Test electrical systems or continuity of circuits in electrical wiring, equipment, or fixtures, using testing devices, such as ohmmeters, voltmeters, or oscilloscopes, to ensure compatibility and safety of the system.
- Use a variety of tools or equipment, such as power construction equipment, measuring devices, power tools, and testing equipment, such as oscilloscopes, ammeters, or test lamps.
- Inspect electrical systems, equipment, or components to identify hazards, defects, or the need for adjustment or repair, and to ensure compliance with codes.
- Prepare sketches or follow blueprints to determine the location of wiring or equipment and to ensure conformance to building and safety codes.
- Diagnose malfunctioning systems, apparatus, or components, using test equipment and hand tools to locate the cause of a breakdown and correct the problem.
- Work from ladders, scaffolds, or roofs to install, maintain, or repair electrical wiring, equipment, or fixtures.
- Advise management on whether continued operation of equipment could be hazardous.
- Maintain current electrician’s license or identification card to meet governmental regulations.
- Place conduit, pipes, or tubing, inside designated partitions, walls, or other concealed areas, and pull insulated wires or cables through the conduit to complete circuits between boxes.
- Direct or train workers to install, maintain, or repair electrical wiring, equipment, or fixtures.
Tools used in this occupation
- Cable reels — Single reel cable trailers; Wheeled wire dispensers; Wire dollies; Wire hand caddies
- Stripping tools — Cable jacket strippers; Self-adjusting insulation strippers; Universal stripping tools; Wire strippers
- Voltage or current meters — Non-contact voltage detectors; Test lamps; Volt tick meters; Voltmeters
- Wire lug crimping tool — Ratchet crimper kits; Terminal crimpers; Wire crimpers; Wire crimping tools
- Wire or cable cutter — Cable cutters; High-leverage cable cutters; Insulated cable cutters; Utility cable cutters
Technology used in this occupation
- Analytical or scientific software — Construction Master Pro; Electrosoft FlashWorks; Elite Software Inpoint; SoftEmpire Electrical Calculations
- Computer-aided design CAD software — Autodesk AutoCAD; One Mile Up Panel Planner; SmartDraw
- Database user interface and query software — Insight Direct ServiceCEO; Resolve Systems Service Management; Sage 300 Construction and Real Estate; Shafer Service Systems
- Industrial control software — Supervisory control and data acquisition SCADA software; Wonderware InTouch
- Word processing software — Microsoft Word; Socrates Contractor’s Library
Knowledge
- Building and Construction — Knowledge of materials, methods, and the tools involved in the construction or repair of houses, buildings, or other structures such as highways and roads.
- Mechanical — Knowledge of machines and tools, including their designs, uses, repair, and maintenance.
- Mathematics — Knowledge of arithmetic, algebra, geometry, calculus, statistics, and their applications.
- Design — Knowledge of design techniques, tools, and principles involved in the production of precision technical plans, blueprints, drawings, and models.
- English Language — Knowledge of the structure and content of the English language including the meaning and spelling of words, rules of composition, and grammar.
- Public Safety and Security — Knowledge of relevant equipment, policies, procedures, and strategies to promote effective local, state, or national security operations for the protection of people, data, property, and institutions.
- Customer and Personal Service — Knowledge of principles and processes for providing customer and personal services. This includes customer needs assessment, meeting quality standards for services, and evaluation of customer satisfaction.
- Administration and Management — Knowledge of business and management principles involved in strategic planning, resource allocation, human resources modeling, leadership technique, production methods, and coordination of people and resources.
- Physics — Knowledge, and prediction of physical principles, laws, their interrelationships, and applications to understanding fluid, material, and atmospheric dynamics, and mechanical, electrical, atomic, and sub-atomic structures and processes.
- Education and Training — Knowledge of principles and methods for curriculum and training design, teaching and instruction for individuals and groups, and the measurement of training effects.
Skills
- Troubleshooting — Determining causes of operating errors and deciding what to do about it.
- Repairing — Repairing machines or systems using the needed tools.
- Active Listening — Giving full attention to what other people are saying, taking time to understand the points being made, asking questions as appropriate, and not interrupting at inappropriate times.
- Critical Thinking — Using logic and reasoning to identify the strengths and weaknesses of alternative solutions, conclusions, or approaches to problems.
- Judgment and Decision Making — Considering the relative costs and benefits of potential actions to choose the most appropriate one.
- Installation — Installing equipment, machines, wiring, or programs to meet specifications.
- Active Learning — Understanding the implications of new information for both current and future problem-solving and decision-making.
- Complex Problem Solving — Identifying complex problems and reviewing related information to develop and evaluate options and implement solutions.
- Equipment Maintenance — Performing routine maintenance on equipment and determining when and what kind of maintenance is needed.
- Instructing — Teaching others how to do something.
- Monitoring — Monitoring/Assessing performance of yourself, other individuals, or organizations to make improvements or take corrective action.
- Quality Control Analysis — Conducting tests and inspections of products, services, or processes to evaluate quality or performance.
- Speaking — Talking to others to convey information effectively.
- Coordination — Adjusting actions in relation to others’ actions.
- Equipment Selection — Determining the kind of tools and equipment needed to do a job.
Abilities
- Troubleshooting — Determining causes of operating errors and deciding what to do about it.
- Repairing — Repairing machines or systems using the needed tools.
- Active Listening — Giving full attention to what other people are saying, taking time to understand the points being made, asking questions as appropriate, and not interrupting at inappropriate times.
- Critical Thinking — Using logic and reasoning to identify the strengths and weaknesses of alternative solutions, conclusions, or approaches to problems.
- Judgment and Decision Making — Considering the relative costs and benefits of potential actions to choose the most appropriate one.
- Installation — Installing equipment, machines, wiring, or programs to meet specifications.
- Active Learning — Understanding the implications of new information for both current and future problem-solving and decision-making.
- Complex Problem Solving — Identifying complex problems and reviewing related information to develop and evaluate options and implement solutions.
- Equipment Maintenance — Performing routine maintenance on equipment and determining when and what kind of maintenance is needed.
- Instructing — Teaching others how to do something.
- Monitoring — Monitoring/Assessing performance of yourself, other individuals, or organizations to make improvements or take corrective action.
- Quality Control Analysis — Conducting tests and inspections of products, services, or processes to evaluate quality or performance.
- Speaking — Talking to others to convey information effectively.
- Coordination — Adjusting actions in relation to others’ actions.
- Equipment Selection — Determining the kind of tools and equipment needed to do a job.
Work Activities
- Getting Information — Observing, receiving, and otherwise obtaining information from all relevant sources.
- Identifying Objects, Actions, and Events — Identifying information by categorizing, estimating, recognizing differences or similarities, and detecting changes in circumstances or events.
- Making Decisions and Solving Problems — Analyzing information and evaluating results to choose the best solution and solve problems.
- Handling and Moving Objects — Using hands and arms in handling, installing, positioning, and moving materials, and manipulating things.
- Inspecting Equipment, Structures, or Material — Inspecting equipment, structures, or materials to identify the cause of errors or other problems or defects.
- Monitor Processes, Materials, or Surroundings — Monitoring and reviewing information from materials, events, or the environment, to detect or assess problems.
- Updating and Using Relevant Knowledge — Keeping up-to-date technically and applying new knowledge to your job.
- Organizing, Planning, and Prioritizing Work — Developing specific goals and plans to prioritize, organize, and accomplish your work.
- Evaluating Information to Determine Compliance with Standards — Using relevant information and individual judgment to determine whether events or processes comply with laws, regulations, or standards.
- Performing General Physical Activities — Performing physical activities that require considerable use of your arms and legs and moving your whole body, such as climbing, lifting, balancing, walking, stooping, and handling of materials.
- Communicating with Supervisors, Peers, or Subordinates — Providing information to supervisors, co-workers, and subordinates by telephone, in written form, e-mail, or in person.
- Training and Teaching Others — Identifying the educational needs of others, developing formal educational or training programs or classes, and teaching or instructing others.
Work Context
- Wear Common Protective or Safety Equipment such as Safety Shoes, Glasses, Gloves, Hearing Protection, Hard Hats, or Life Jackets — 81% responded “Every day.”
- Spend Time Standing — 74% responded “Continually or almost continually.”
- Face-to-Face Discussions — 90% responded “Every day.”
- Contact With Others — 66% responded “Constant contact with others.”
- Sounds, Noise Levels Are Distracting or Uncomfortable — 68% responded “Every day.”
- Spend Time Using Your Hands to Handle, Control, or Feel Objects, Tools, or Controls — 71% responded “Continually or almost continually.”
- Importance of Being Exact or Accurate — 48% responded “Very important.”
- Responsible for Others’ Health and Safety — 55% responded “High responsibility.”
- Freedom to Make Decisions — 46% responded “A lot of freedom.”
- Exposed to Hazardous Conditions — 48% responded “Every day.”
- Telephone — 67% responded “Every day.”
- Time Pressure — 60% responded “Every day.”
Interests
- Realistic — Realistic occupations frequently involve work activities that include practical, hands-on problems and solutions. They often deal with plants, animals, and real-world materials like wood, tools, and machinery. Many of the occupations require working outside and do not involve a lot of paperwork or working closely with others.
- Investigative — Investigative occupations frequently involve working with ideas and require an extensive amount of thinking. These occupations can involve searching for facts and figuring out problems mentally.
- Conventional — Conventional occupations frequently involve following set procedures and routines. These occupations can include working with data and details more than with ideas. Usually, there is a clear line of authority to follow.
Work Styles
- Dependability — Job requires being reliable, responsible, and dependable, and fulfilling obligations.
- Attention to Detail — Job requires being careful about detail and thorough in completing work tasks.
- Integrity — Job requires being honest and ethical.
- Analytical Thinking — Job requires analyzing information and using logic to address work-related issues and problems.
- Initiative — Job requires a willingness to take on responsibilities and challenges.
- Leadership — Job requires a willingness to lead, take charge, and offer opinions and direction.
- Self-Control — Job requires maintaining composure, keeping emotions in check, controlling anger, and avoiding aggressive behavior, even in very difficult situations.
- Adaptability/Flexibility — Job requires being open to change (positive or negative) and to considerable variety in the workplace.
- Persistence — Job requires persistence in the face of obstacles.
Work Values
- Independence — Occupations that satisfy this work value allow employees to work on their own and make decisions. Corresponding needs are Creativity, Responsibility, and Autonomy.
- Support — Occupations that satisfy this work value offer supportive management that stands behind employees. Corresponding needs are Company Policies, Supervision: Human Relations and Supervision: Technical.
- Achievement — Occupations that satisfy this work value are results-oriented and allow employees to use their strongest abilities, giving them a feeling of accomplishment. Corresponding needs are Ability Utilization and Achievement.
Performance Measures
Internal Key Performance Indicators (Sources: Internal data collections, and Post-Graduate Surveys)
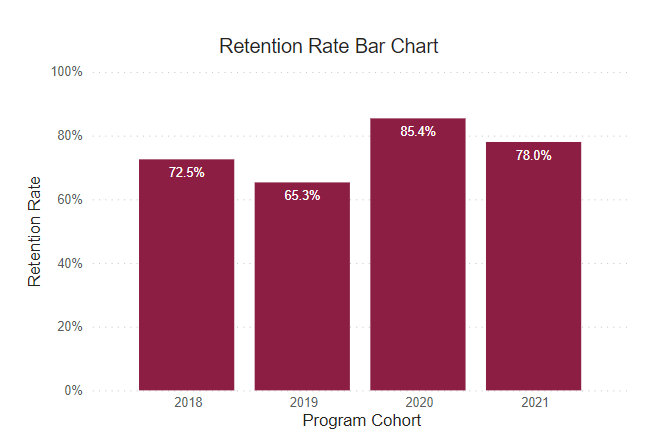
Retention Rate
This rate reflects the continuous term-to-term persistence rate for certificate programs and the fall-to-fall retention rate for associate degree programs.
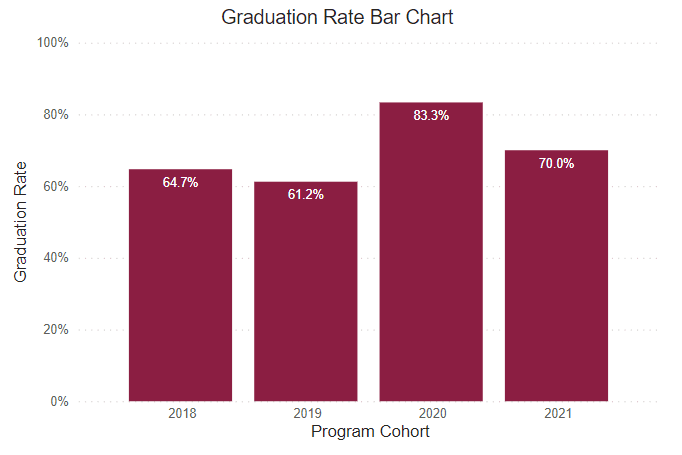
Graduation Rate
This rate reflects the number of freshmen who were officially enrolled in the fall semester and earned a certificate or degree within the expected timeframe.
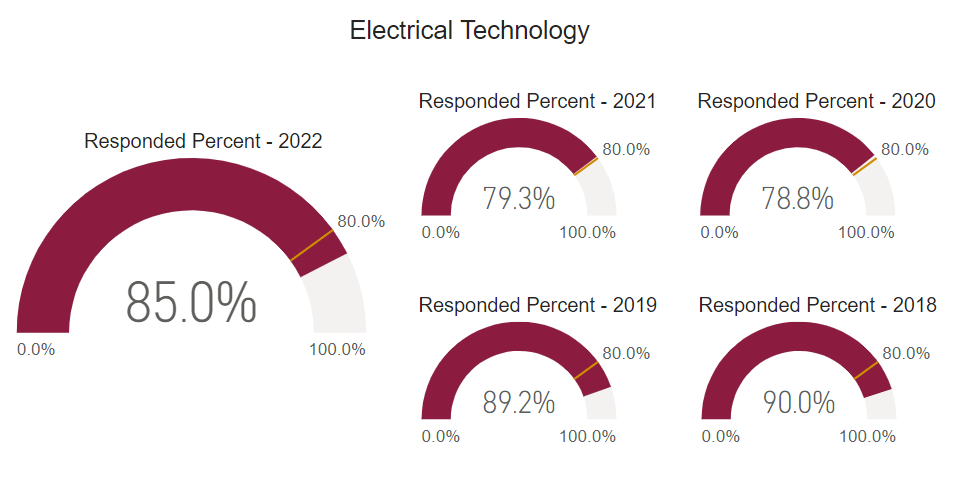
Post Graduate Survey Response Rate
The post graduate survey is an annual on-line post graduate survey utilized by the college to gather vital information regarding career placement, starting salary, and level of satisfaction.
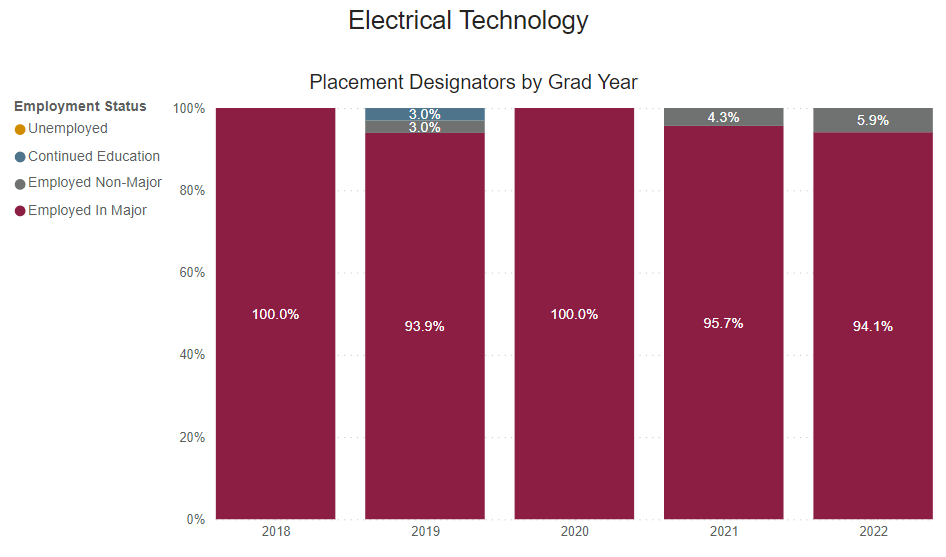
Employed Full Time Outside of Major
Percentage of graduates who reported being employed full-time outside their field of study.
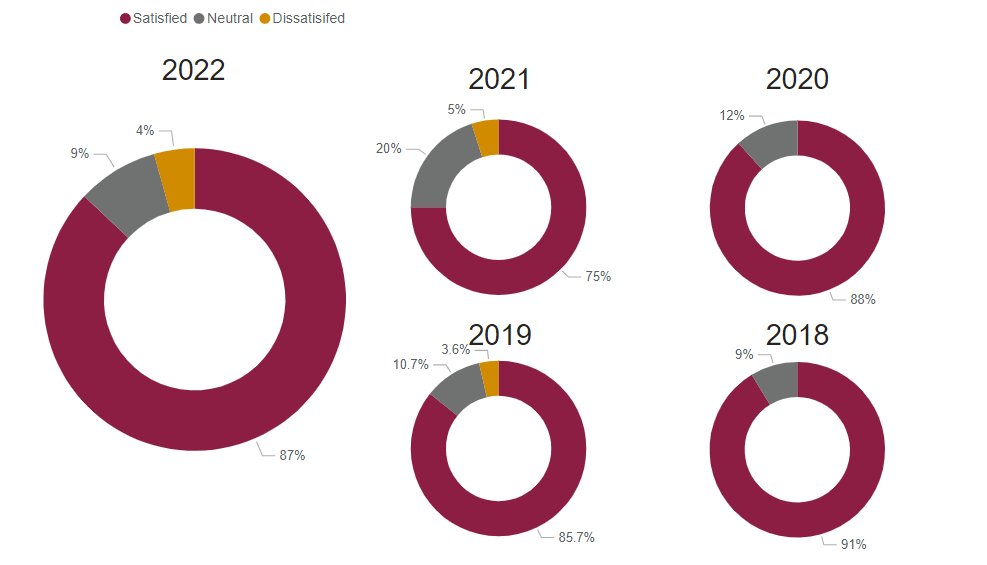
Graduate Satisfaction
This is the median graduate survey response evaluating the level of preparation for workforce entry (based on a 5-Item Likert Scale).
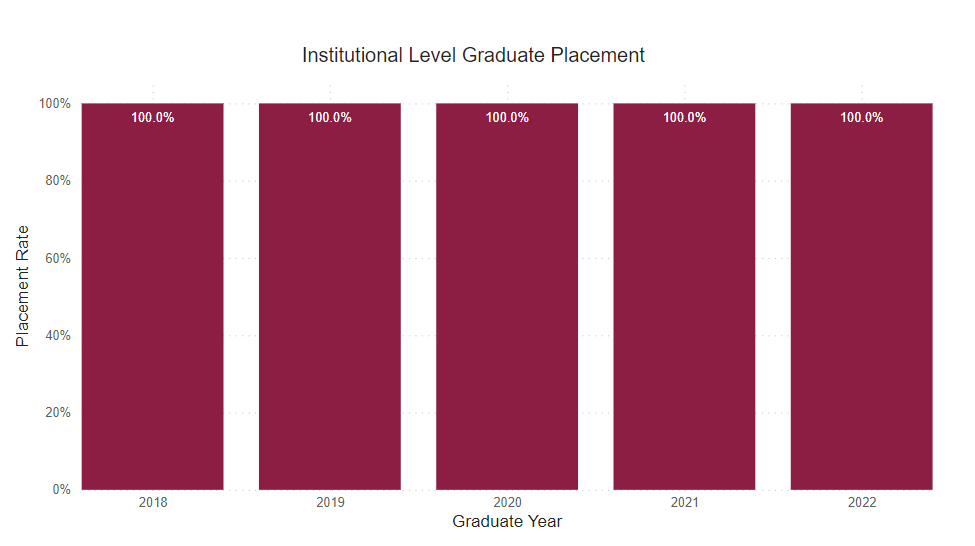
Placement Rate
This is the percent of graduate survey respondents who reported being employed or continued their education on a full-time basis.
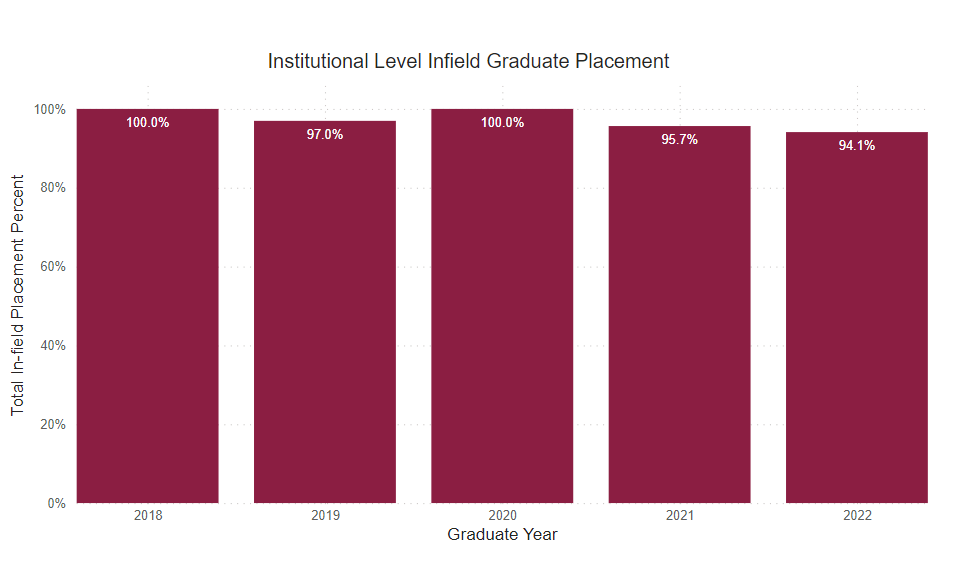
Employed Full Time Within Major
Percentage of graduates who reported being employed full-time within their field of study.
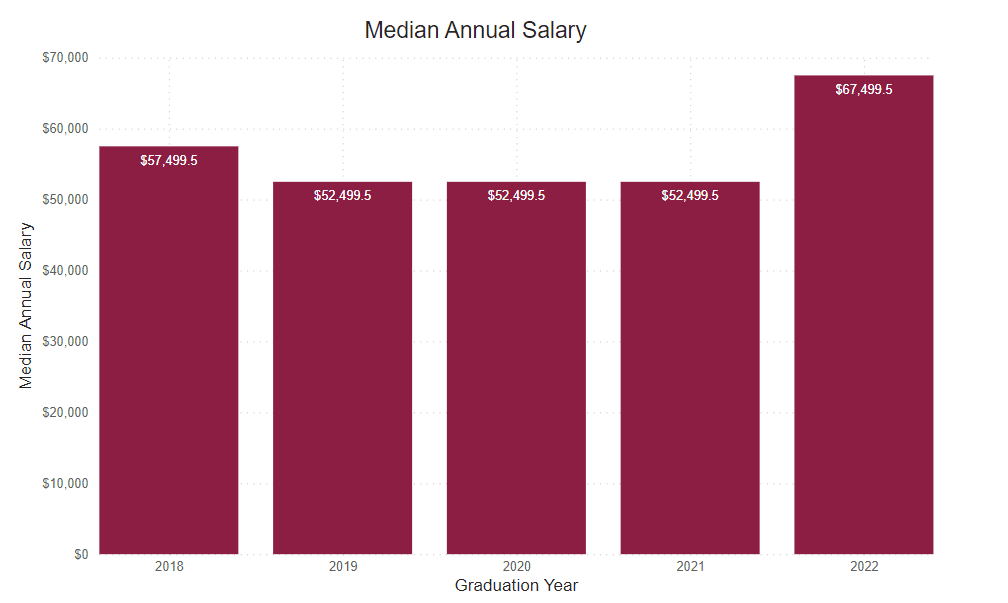
Annual Median Starting Salary
This number is based on the graduate survey response to the request to identify a starting salary from a range of options. This graph shows the median first-year annual salary. All calculations are based on the respondent’s self-reported first-year annual income.
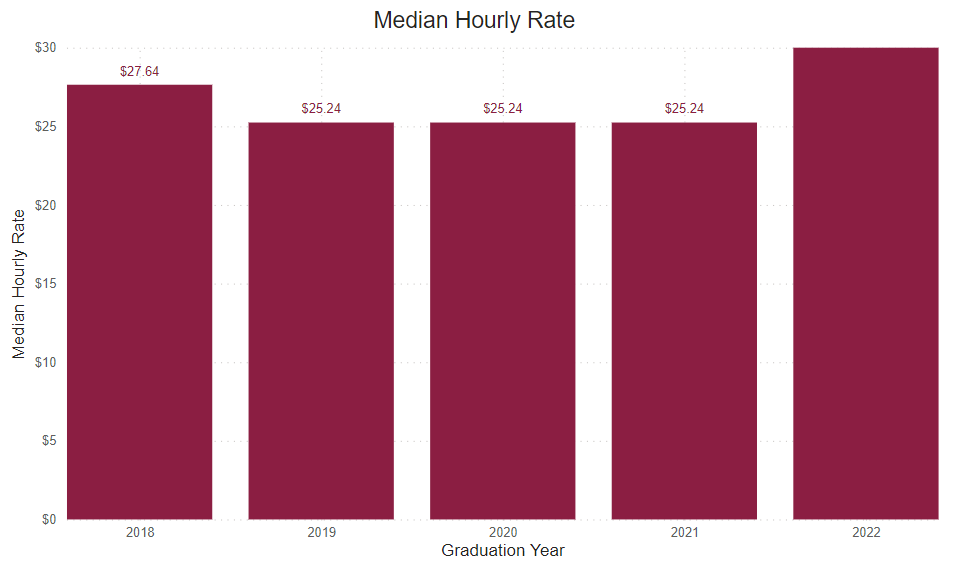
Reported Hourly Rate
This number is determined by dividing the reported median salary by the number of hours in a traditional full-time work week (40), then the number of weeks in a year (52).

Our graduates work with the industry’s best
