
Institutional Performance Measures
Thaddeus Stevens College of Technology is committed to continuous improvement and monitors its institutional effectiveness (how well its performance matches its purpose) by monitoring several key performance measures.
Key Performance Indicators
(sources: internal data collections and post-graduate surveys)
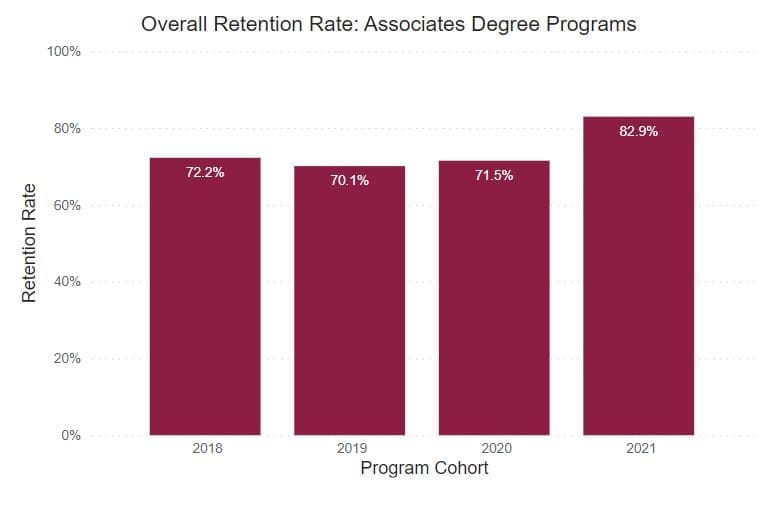
Retention Rate
Reflects the continuous term-to-term persistence rate for certificate programs and the fall-to-fall retention rate for associate degree programs.
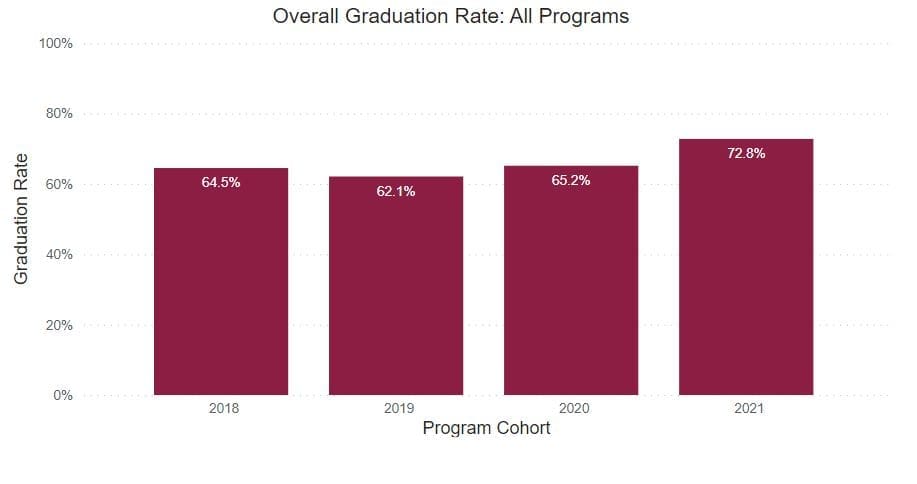
Graduation Rate
Reflects the number of students who complete a program of study within 150% of normal completion time (e.g., completion of an associate degree within 6 semesters or a certificate in 3 semesters for years 2020 and after). 2019 and earlier graduation rates are based on associate degree completion within 3 years (150% percent of normal time) and certificate completion in 2 years (200% of normal time).
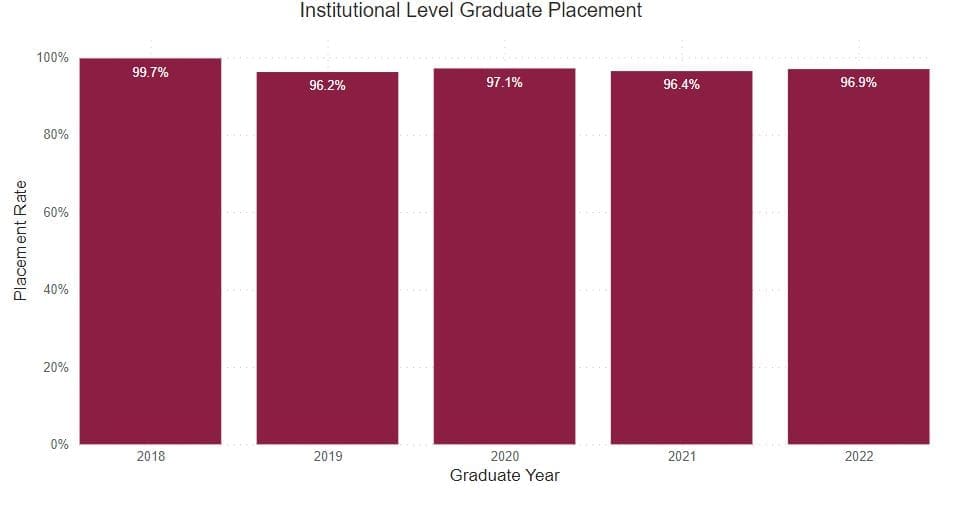
Placement Rate
This is the percentage of graduate survey respondents who reported being employed or continuing their education on a full-time basis.
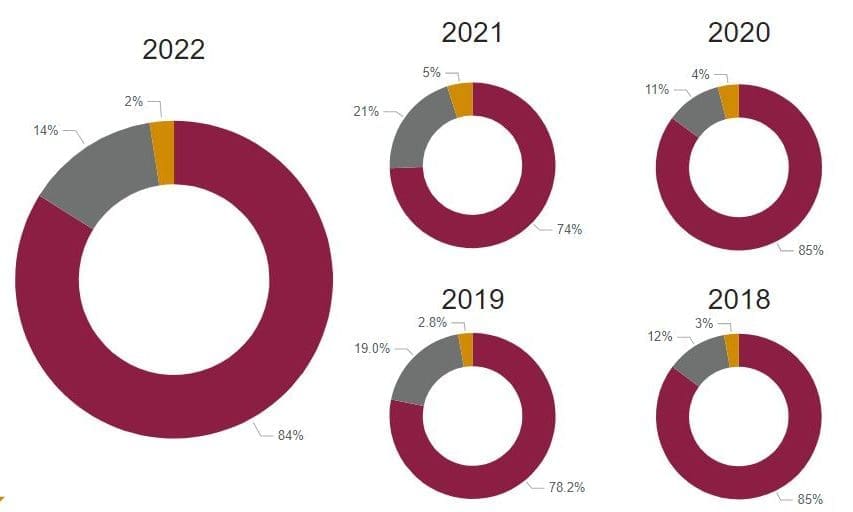
Graduate Satisfaction
This is the median graduate survey response evaluating the level of preparation for workforce entry (based on a 5-item Likert Scale). Crimson = Satisfied, Gray = Neutral, Gold = Dissatisfied.
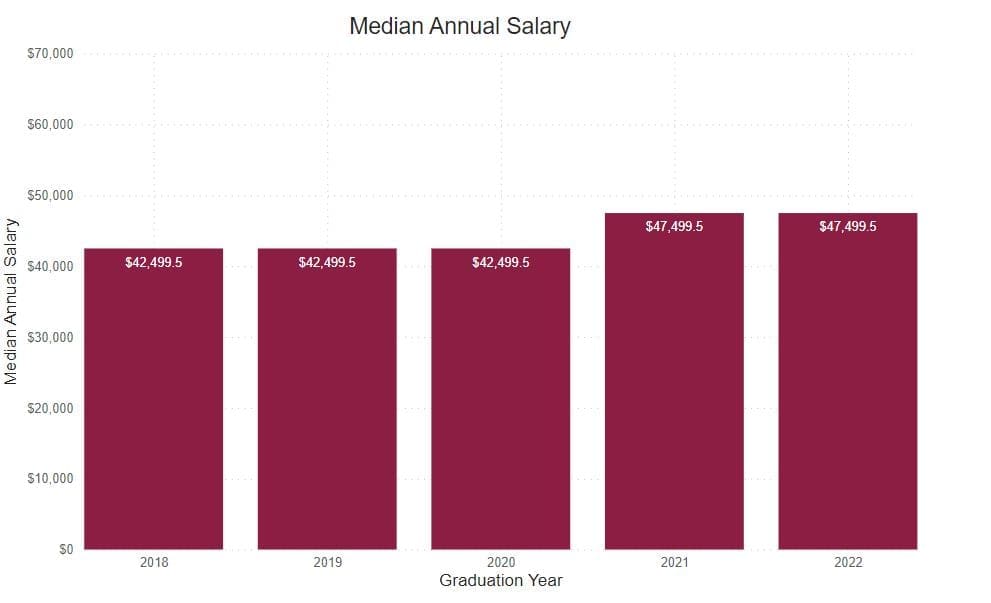
Annual Median Starting Salary
This is based on the graduate survey response to the request to identify a starting salary from a range of options. This graph shows the median first-year annual salary. All calculations are based on the respondent’s self-reported first-year annual income. For program-specific salary information see each individual program page. Rounded to the nearest thousand dollar.
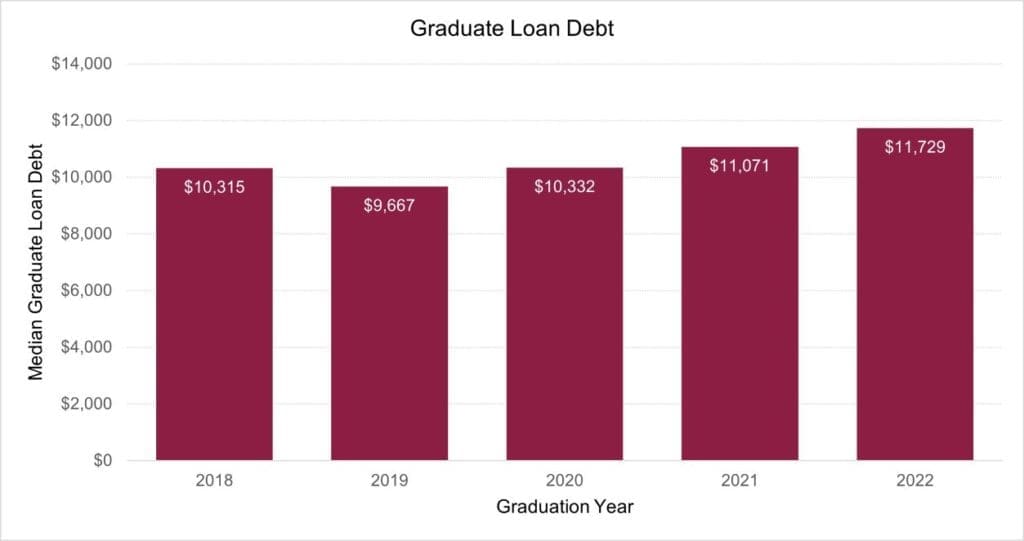
Students with Loan Debt
Students with Loan Debt (Median)
- Student Loan Profile: derived from combining the total amount of all student loans received by the student during their time at Stevens. Since TSCT is a residential college, much of the debt is incurred as a result of room and board expenses.
- Students with Loan Debt reflects the percentage of students with loan debt.
- Student Loan Debt indicates the median amount of student loan debt.

National Center for Education Statistics
The Integrated Postsecondary Education Data System (IPEDS) is a system of survey components that collects data from about 7,500 institutions that provide postsecondary education across the United States. IPEDS collects institution-level data on student enrollment, graduation rates, student charges, program completions, faculty, staff, and finances. These data are used at the federal and state levels for policy analysis and development; at the institutional level for benchmarking and peer analysis; and by students and parents, through the College Navigator, an online tool to aid in the college search process.
The Chronicle of Higher Education – College Completion
College Completion is a microsite produced by The Chronicle of Higher Education with support from the Bill & Melinda Gates Foundation. Its goal is to share data on completion rates in American higher education in a visually stimulating way. Our hope is that, as you browse around the site, you will find your own stories in the statistics and use the tools we provide to download data files; share charts through your own presentations; and comment, start conversations, or provide tips about this important topic.