
Computer Software Engineering Technology
Get started today
About Computer Software Engineering Technology
Computers have become a major factor in the development and operation of the modern industry. From providing means of communications, to operating machines, to facilitating international commerce, to systems animation, computers and their related software programs makes things possible.
The Computer Software Engineering Technology program prepares students to design, develop, and build customized software programs for specific applications. Specifically, students will learn basic programming, how to interpret specifications, application of software architecture, verification and validation principles, and software performance standards. Students will create software programs which address known specifications. The program emphasizes a practical hands-on education as software projects are required each semester.
Upon completion of the program, graduates will find a wealth of employment opportunities in a variety of businesses and industries. Unlike some disciplines which are tied directly to a specific technical area, graduates of this program will work in small businesses, large industries, private organizations, software specialty businesses, IT Department, Government, and other agencies.
What you’ll learn
- Edit and modify existing software programs with the aim of upgrading and correcting errors.
- Improve the performance of software programs, or adapt it to new and old hardware and software.
- Analyze the needs of users for project design.
- Design and modify software systems for specific applications
- Analyze and recommend all necessary system layouts and modifications.
- Train users how to make use of new software.
Sample Job Titles
Application Developer, Application Integration Engineer, Developer, Infrastructure Engineer, Network Engineer, Software Architect, Software Developer, Software Development Engineer, Software Engineer, Systems Engineer
Quick facts
Location
Griscom Education Center, Lobby Level
Type of program
Associate Degree
Job/Salary Outlook
See industry data
Length of program
2 years, 73 credits
Cost of program
$4,500/semester tuition
$3,000 – $3,500/semester housing
$1,850 – $2,335/semester meal plan
Tool List (PDF)

The outcomes speak for themselves
The Computer Software Engineering Technology program prepares students to design, develop, and build customized software programs for specific applications.
77.2%
employment
$52.5K
med. salary
9.1%
cont. education
People of TSCT
Success stories

Program details
Courses
MODEL SCHEDULE FOR COMPUTER SOFTWARE ENGINEERING TECHNOLOGY
Semester 1
- CSET 105 Intro to Web Applications (3 credits)
- CSET 110 Web Development I (3 credits)
- CSET 115 Technical Requirements & Data Structures (3 credits)
- CSET 120 Software Project I (3 credits)
- BUSN 106 Small Business Management (3 credits)
- ENG 221 Public Speaking (3 credits)
Semester 2
- CSET 155 Database Design (3 credits)
- CSET 160 Web Development II (3 credits)
- CSET 170 Security & Professional Ethics (3 credits)
- CSET 180 Software Project II (3 credits)
- MATH 137 Intermediate Algebra (or higher) (3 credits)
- ENG 106 English Composition (3 credits)
Semester 3
- CSET 205 Advanced Data Integration (3 credits)
- CSET 222 Database Management Systems (3 credits)
- CSET 210 Workplace Communications (3 credits)
- CSET 220 Software Project III (3 credits)
- ENG 216 Technical Report Writing (3 credits)
- CIS 111 Introduction to Computer Applications (3 credits)
Semester 4
- CSET 265 Software Principles (3 credits)
- CSET 270 Mobile Development (4 credits)
- CSET 280 Capstone Project OR CSET 290 CSET Internship (4 credits)
- PHYS 106 Physics for Everyday Life (OR any CHEM, BIO, SCI, or Higher PHYS) (3 credits)
Additional General Education Requirements
- HEAL 106 or HEAL 111 (1 credit)
- Humanities Elective (3 credits)
Total Credits 73
Faculty
Md Mainul Chowdhury
Instructor, Computer Software Engineering Technology 1st chowdhury@stevenscollege.eduMohammad Ashraful Huq
Instructor, Computer Software Engineering Technology 2nd AshrafulHuq@stevenscollege.eduOccupational Advisory Committee
The Occupational Advisory Committee (OAC) serves as a vital link between the Program of study and industry, ensuring that the program remains aligned with current workforce needs, technological advancements, and best practices in the field. Composed of employers, educators, and other community members, the committee provides guidance, feedback, and recommendations to enhance the curriculum, instructional methods, and student learning experiences.
Purpose and Responsibilities:
- Curriculum & Industry Alignment
- Workforce Readiness
- Student & Faculty Support
- Internship & Employment Connections
- Accreditation & Program Evaluation
- Facilities & Equipment Recommendations
By fostering a strong relationship between academia and industry, the OAC helps ensure that Thaddeus Stevens College programs maintain the highest standards in CTE (career and technical education).
- Alexis Gosik, Technology Council of Central PA
- Brandon Green, TAIT Towers
Essential Skills Learned
Tasks
- Analyze information to determine, recommend, and plan the installation of a new system or modification of an existing system.
- Analyze user needs and software requirements to determine the feasibility of design within time and cost constraints.
- Confer with data processing or project managers to obtain information on limitations or capabilities for data processing projects.
- Confer with systems analysts, engineers, programmers, and others to design systems and to obtain information on project limitations and capabilities, performance requirements, and interfaces.
- Consult with customers or other departments on project status, proposals, or technical issues, such as software system design or maintenance.
- Coordinate installation of software system.
- Design, develop and modify software systems, using scientific analysis and mathematical models to predict and measure outcomes and consequences of design.
Tools used in this occupation
- Analyze project data to determine specifications or requirements.
- Modify software programs to improve performance.
- Supervise information technology personnel.
- Apply mathematical principles or statistical approaches to solve problems in scientific or applied fields.
- Assess database performance.
- Assign duties or work schedules to employees.
Technology used in this occupation
- Database management system software — MySQL; PostgreSQL; SQL-based RDBMS
- Database user interface and query software — MySQL Workbench; phpMyAdmin; Python with SQLAlchemy
- Development environment software — Visual Studio Code; GitHub; Git; IntelliJ · Object or component-oriented development software — JavaScript (ES6+); Python; Java; PHP; Object-Oriented Design Principles
- Web platform development software — HTML5; CSS3; JavaScript; Flask (Python); Laravel; Responsive Design · Mobile development software — Android Studio (if Android is the platform of focus); Cross-platform SDKs, Flutter
- Version control systems — Git; GitHub · Security-related technologies — SSL/TLS; Secure web development practices
Knowledge
- Engineering and Technology — Knowledge of the practical application of engineering science and technology. This includes applying principles, techniques, procedures, and equipment to the design and production of various goods and services.
- English Language — Knowledge of the structure and content of the English language, including the meaning and spelling of words, rules of composition, and grammar.
- Mathematics — Knowledge of arithmetic, algebra, geometry, calculus, statistics, and their applications.
- Design — Knowledge of design techniques, tools, and principles involved in the production of precision technical plans, blueprints, drawings, and models.
Skills
- Programming — Writing computer programs for various purposes.
- Systems Analysis — Determining how a system should work and how changes in conditions, operations, and the environment will affect outcomes.
- Systems Evaluation — Identifying measures or indicators of system performance and the actions needed to improve or correct performance, relative to the goals of the system.
- Judgment and Decision Making — Considering the relative costs and benefits of potential actions to choose the most appropriate one.
- Complex Problem Solving — Identifying complex problems and reviewing related information to develop and evaluate options and implement solutions
Abilities
- Deductive Reasoning — The ability to apply general rules to specific problems to produce answers that make sense.
- Inductive Reasoning — The ability to combine pieces of information to form general rules or conclusions (includes finding a relationship among seemingly unrelated events).
- Problem Sensitivity — The ability to tell when something is wrong or is likely to go wrong. It does not involve solving the problem, only recognizing there is a problem.
- Information Ordering — The ability to arrange things or actions in a certain order or pattern according to a specific rule or set of rules (e.g., patterns of numbers, letters, words, pictures, mathematical operations).
- Near Vision — The ability to see details at close range (within a few feet of the observer).
Work Activities
- Interacting with Computers — Using computers and computer systems (including hardware and software) to program, write software, set up functions, enter data, or process information.
- Making Decisions and Solving Problems — Analyzing information and evaluating results to choose the best solution and solve problems.
- Updating and Using Relevant Knowledge — Keeping up-to-date technically and applying new knowledge to your job.
- Communicating with Supervisors, Peers, or Subordinates — Providing information to supervisors, co-workers, and subordinates by telephone, in written form, e-mail, or in person.
- Getting Information — Observing, receiving, and otherwise obtaining information from all relevant sources
Work Context
- Face-to-Face Discussions – How often do you have to have face-to-face discussions with individuals or teams in this job?
- Electronic Mail — 100% responded “Every day.”
- Spend Time Sitting — 99% responded “Continually or almost continually.”
- Face-to-Face Discussions — 87% responded “Every day.
- Work With Work Group or Team — 82% responded “Extremely important.”
- Importance of Being Exact or Accurate — 51% responded “Extremely important.”
Interests
- Investigative — Investigative occupations frequently involve working with ideas and require an extensive amount of thinking. These occupations can involve searching for facts and figuring out problems mentally.
- Realistic — Realistic occupations frequently involve work activities that include practical, hands-on problems, and solutions. They often deal with plants, animals, and real-world materials like wood, tools, and machinery. Many of the occupations require working outside and do not involve a lot of paperwork or working closely with others.
- Conventional — Conventional occupations frequently involve following set procedures and routines. These occupations can include working with data and details more than with ideas. Usually, there is a clear line of authority to follow.
Work Styles
- Analytical Thinking — Job requires analyzing information and using logic to address work-related issues and problems.
- Attention to Detail — Job requires being careful about detail and thorough in completing work tasks.
- Innovation — Job requires creativity and alternative thinking to develop new ideas for and answers to work-related problems.
- Integrity — Job requires being honest and ethical.
- Achievement/Effort — Job requires establishing and maintaining personally challenging achievement goals and exerting effort toward mastering tasks.
Work Values
- Working Conditions — Occupations that satisfy this work value offer job security and good working conditions. Corresponding needs are Activity, Compensation, Independence, Security, Variety, and Working Conditions.
- Recognition — Occupations that satisfy this work value offer advancement, the potential for leadership, and are often considered prestigious. Corresponding needs are Advancement, Authority, Recognition, and Social Status.
- Achievement — Occupations that satisfy this work value are results-oriented and allow employees to use their strongest abilities, giving them a feeling of accomplishment. Corresponding needs are Ability Utilization and Achievement.
Performance Measures
Internal Key Performance Indicators (Sources: Internal data collections, and Post-Graduate Surveys)
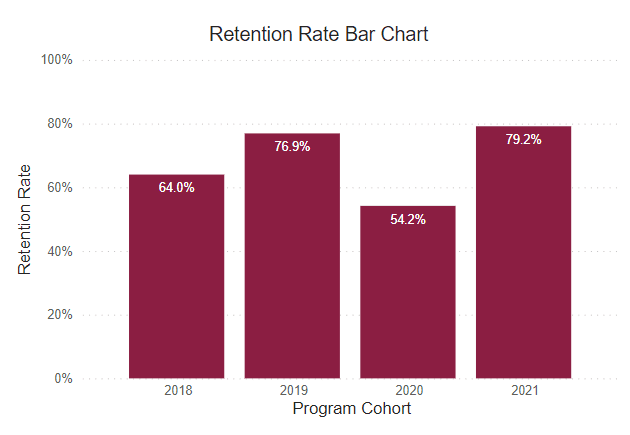
Retention Rate
This rate reflects the continuous term-to-term persistence rate for certificate programs and the fall-to-fall retention rate for associate degree programs.
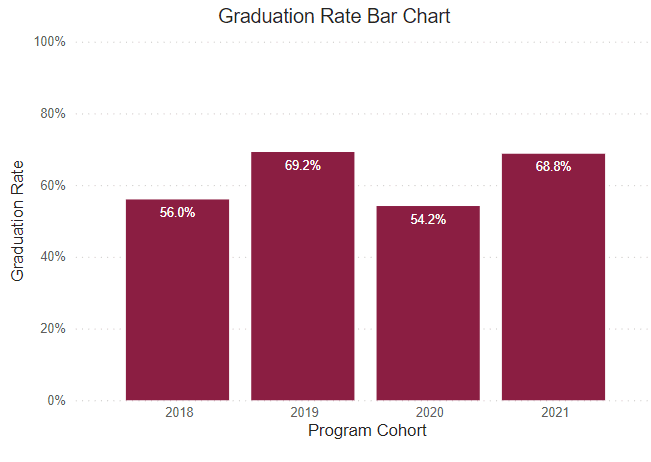
Graduation Rate
This rate reflects the number of freshmen who were officially enrolled in the fall semester and earned a certificate or degree within the expected timeframe.
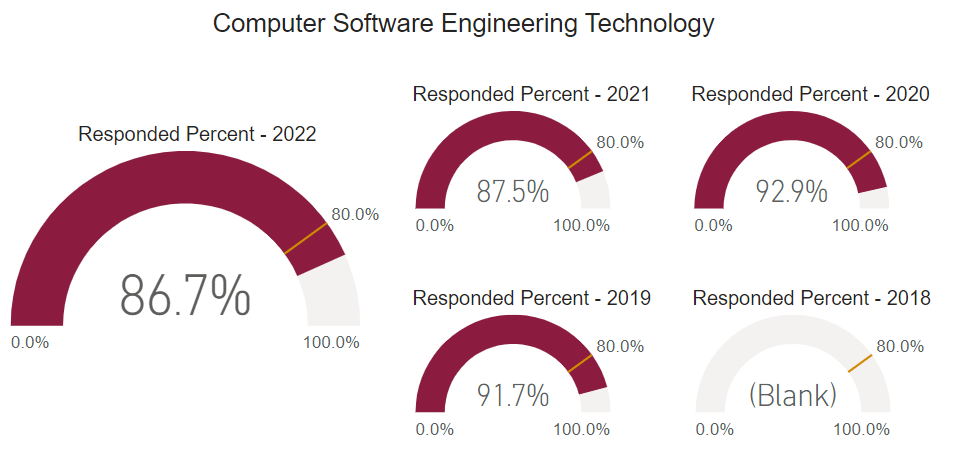
Post Graduate Survey Response Rate
The post graduate survey is an annual on-line post graduate survey utilized by the college to gather vital information regarding career placement, starting salary, and level of satisfaction.
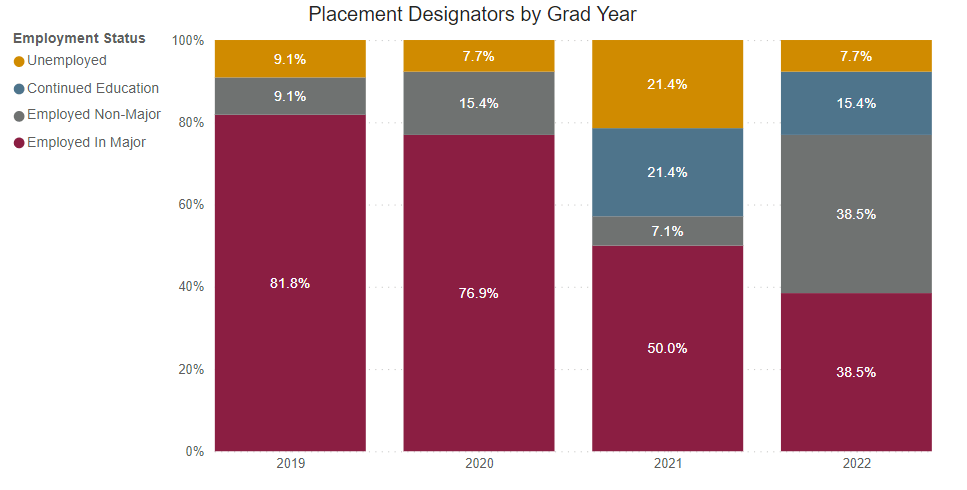
Employed Full Time Outside of Major
Percentage of graduates who reported being employed full-time outside their field of study.
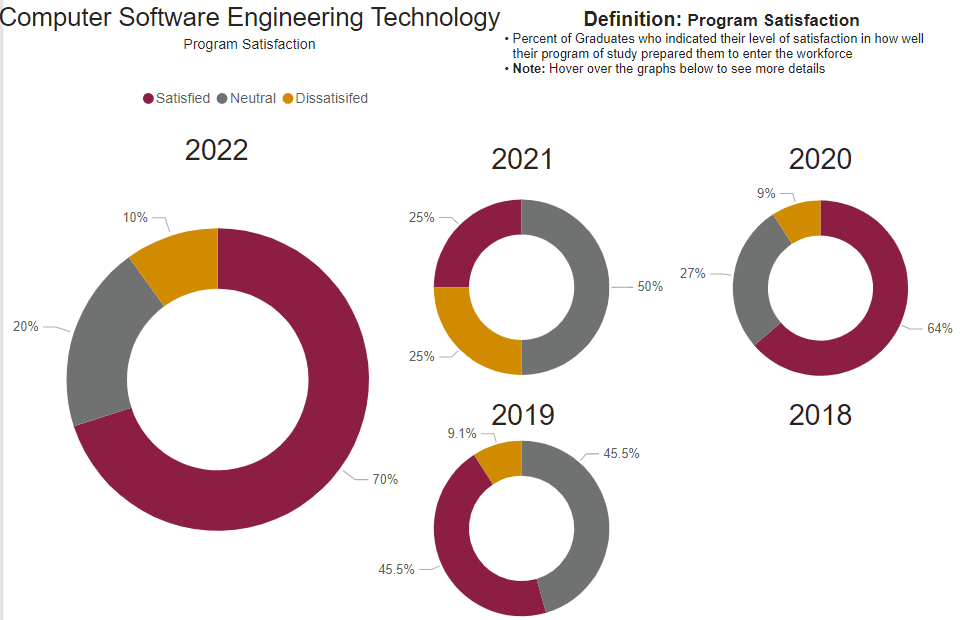
Graduate Satisfaction
This is the median graduate survey response evaluating the level of preparation for workforce entry (based on a 5-Item Likert Scale).
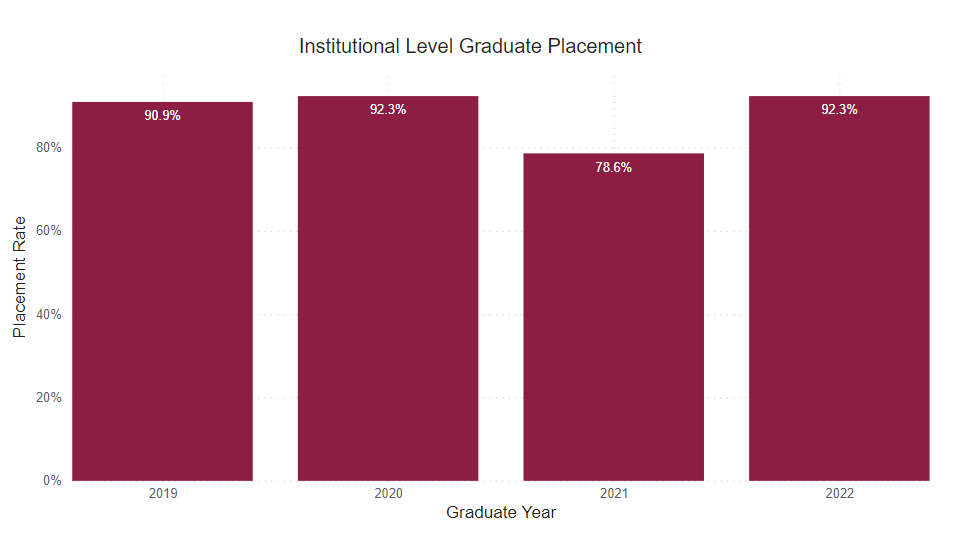
Placement Rate
This is the percent of graduate survey respondents who reported being employed or continued their education on a full-time basis.
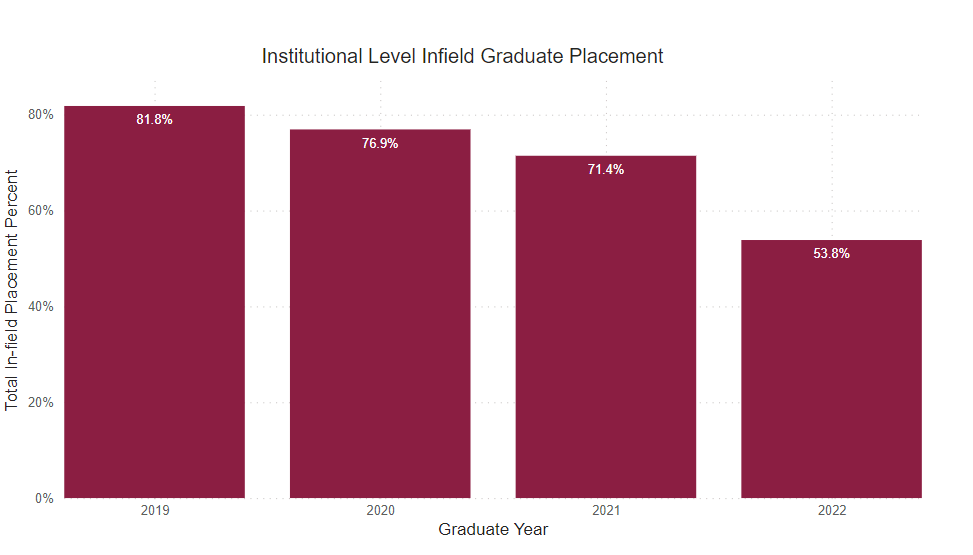
Employed Full Time Within Major
Percentage of graduates who reported being employed full-time within their field of study.
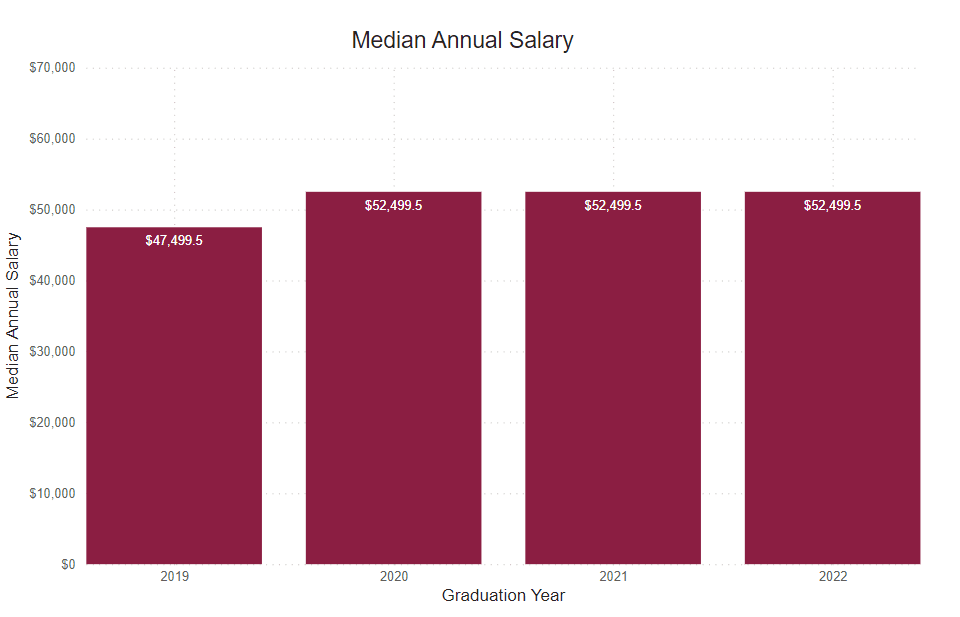
Annual Median Starting Salary
This number is based on the graduate survey response to the request to identify a starting salary from a range of options. This graph shows the median first-year annual salary. All calculations are based on the respondent’s self-reported first-year annual income.
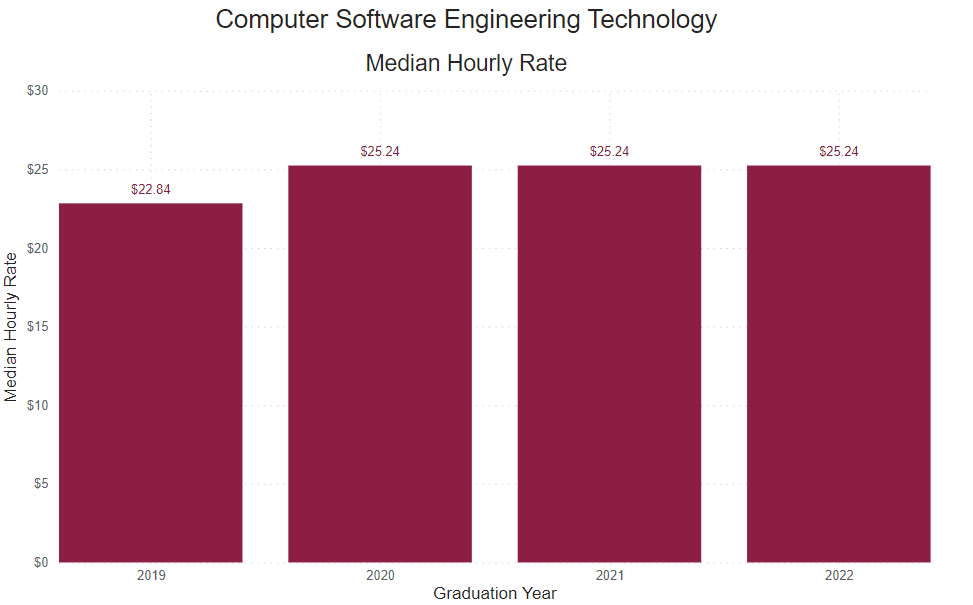
Reported Hourly Rate
This number is determined by dividing the reported median salary by the number of hours in a traditional full-time work week (40), then the number of weeks in a year (52).

Our graduates work with the industry’s best