
Electrical Construction and Maintenance Certificate
Get started today
About the Electrical Construction and Maintenance Certificate
The Electrical Construction and Maintenance certificate program provides students with the opportunity to acquire the theory and skills needed to gain employment as residential, commercial, and industrial construction electricians. Skills are developed through basic electrical theory and practical work project assignments.
This program will give students a broad theoretical and practical background in all aspects of electrical construction.
Graduates of the construction electrician program are prepared to find employment as residential, commercial, and industrial construction electricians. Because of the continual growth in building construction, there are many employment possibilities.
What you’ll learn
- Demonstrate appropriate technical skills in the electrical construction field.
- Demonstrate the ability to design, develop, and troubleshoot residential, commercial, and industrial circuitry.
- Complete parts list and order forms that demonstrate knowledge of coding and numbering systems for devices, hardware, and electrical equipment.
- Interpret, develop, and utilize blueprints, schematic diagrams, and wiring plans to perform electrical construction activities.
- Demonstrate the ability to apply OSHA-accepted safety standards as appropriate.
- Demonstrate knowledge of National Electrical Codes that apply to specific occupancies.
- Demonstrate knowledge of test equipment used in troubleshooting and repair of circuits, distribution systems, and electrical equipment.
Sample Job Titles
Apprentice Electrician, Cable Puller, Electrical Apprentice, Electrician Apprentice, Electrician Helper, Electrician’s Helper.
Quick facts
Location
Griscom Education Center – Lower Level
Type of program
Certificate
Job/Salary Outlook
See industry data
Length of program
9 months, 36 credits
Tool List (PDF)
People of TSCT
Success stories

Program details
Courses
MODEL SCHEDULE FOR ELECTRICAL CONSTRUCTION AND MAINTENANCE
Semester 1
- ECM 106 AC/DC Fundamentals (5 credits)
- ECM 111 Residential Wiring (5 credits)
- ECM 116 Electrical Construction Safety (2 credits)
- MATH 126 Technical Mathematics I (3 credits)
- ENG 106 Composition I (3 credits)
Semester 2
- ECM 156 Commercial/Industrial Wiring (5 credits)
- ECM 162 National Electrical Code (4 credits)
- ECM 166 Blueprint Reading: Electrical (3 credits)
- ELECTIVE Elective (3 credits)
- ELECTIVE Elective (3 credits)
Total Credits 36
Faculty
Michael Dailey
Instructor, Electrical Construction Maintenance Technology daileym@stevenscollege.eduOccupational Advisory Committee
The Occupational Advisory Committee (OAC) serves as a vital link between the Program of study and industry, ensuring that the program remains aligned with current workforce needs, technological advancements, and best practices in the field. Composed of employers, educators, and other community members, the committee provides guidance, feedback, and recommendations to enhance the curriculum, instructional methods, and student learning experiences.
Purpose and Responsibilities:
- Curriculum & Industry Alignment
- Workforce Readiness
- Student & Faculty Support
- Internship & Employment Connections
- Accreditation & Program Evaluation
- Facilities & Equipment Recommendations
By fostering a strong relationship between academia and industry, the OAC helps ensure that Thaddeus Stevens College programs maintain the highest standards in CTE (career and technical education).
- Ed Bernitsky, IBEW LU 743
- Bill Beyer, Campbells Snacks/Pepperidge Farm
- Randy Blair, Heat and Control
- Felix DeJesus, Armstrong World Industries
- Bobby Helsel, III, Tri-M Group, LLC
- Dennis Knepper, PPL Corp.
- Justin Fisher, Americold
- Steven Schriver, Shingle & Gibb Automation
- Kurt Suchar, Schaedler Yesco
- Greg Weikel, Swartley Bros. Engineers, Inc.
Essential Skills Learned
Tasks
- Measure, cut, and bend wire and conduit, using measuring instruments and hand tools. See more occupations related to this task.
- Trace out short circuits in wiring, using test meter. See more occupations related to this task.
- Strip insulation from wire ends, using wire stripping pliers, and attach wires to terminals for subsequent soldering. See more occupations related to this task.
- Examine electrical units for loose connections and broken insulation and tighten connections, using hand tools. See more occupations related to this task.
- Construct controllers and panels, using power drills, drill presses, taps, saws, and punches.
Tools used in this occupation
- Circuit tester — Continuity testers; Growlers; Loop PSC testers; Residual current device RCD testers See more occupations related to this tool.
- Conduit benders — Hydraulic conduit benders; Manual conduit benders; Power conduit benders See more occupations related to this tool.
- Screwdrivers — Cabinet tip screwdrivers; Phillips head screwdrivers; Screw-holding screwdrivers See more occupations related to this tool.
- Voltage or current meters — Current clamps; Non-contact voltage sensors; Voltage meters See more occupations related to this tool.
- Wire or cable cutter — Cable cutters; Insulated cable cutters; Power cable cutters; Ratcheting cable cutters.
Technology used in this occupation
- Computer-aided design CAD software Hot technology — Computer-aided drafting or design software See more occupations related to this technology.
- Database user interface and query software — Recordkeeping software See more occupations related to this technology.
- Office suite software — Microsoft Office software See more occupations related to this technology.
- Spreadsheet software — Microsoft Excel Hot Technology See more occupations related to this technology.
- Word processing software — Report generation software.
Knowledge
- English Language — Knowledge of the structure and content of the English language including the meaning and spelling of words, rules of composition, and grammar. See more occupations related to this knowledge.
- Mechanical — Knowledge of machines and tools, including their designs, uses, repair, and maintenance. See more occupations related to this knowledge.
- Building and Construction — Knowledge of materials, methods, and the tools involved in the construction or repair of houses, buildings, or other structures such as highways and roads. See more occupations related to this knowledge.
- Customer and Personal Service — Knowledge of principles and processes for providing customer and personal services. This includes customer needs assessment, meeting quality standards for services, and evaluation of customer satisfaction. See more occupations related to this knowledge.
- Design — Knowledge of design techniques, tools, and principles involved in the production of precision technical plans, blueprints, drawings, and models.
Skills
- Active Listening — Giving full attention to what other people are saying, taking time to understand the points being made, asking questions as appropriate, and not interrupting at inappropriate times. See more occupations related to this skill.
- Quality Control Analysis — Conducting tests and inspections of products, services, or processes to evaluate quality or performance. See more occupations related to this skill.
- Critical Thinking — Using logic and reasoning to identify the strengths and weaknesses of alternative solutions, conclusions, or approaches to problems. See more occupations related to this skill.
- Repairing — Repairing machines or systems using the needed tools. See more occupations related to this skill.
- Speaking — Talking to others to convey information effectively.
Abilities
- Near Vision — The ability to see details at close range (within a few feet of the observer). See more occupations related to this ability.
- Manual Dexterity — The ability to quickly move your hand, your hand together with your arm, or your two hands to grasp, manipulate, or assemble objects. See more occupations related to this ability.
- Information Ordering — The ability to arrange things or actions in a certain order or pattern according to a specific rule or set of rules (e.g., patterns of numbers, letters, words, pictures, mathematical operations). See more occupations related to this ability.
- Problem Sensitivity — The ability to tell when something is wrong or is likely to go wrong. It does not involve solving the problem, only recognizing there is a problem. See more occupations related to this ability.
- Extent Flexibility — The ability to bend, stretch, twist, or reach with your body, arms, and/or legs.
Work Activities
- Performing General Physical Activities — Performing physical activities that require considerable use of your arms and legs and moving your whole body, such as climbing, lifting, balancing, walking, stooping, and handling of materials. See more occupations related to this activity.
- Getting Information — Observing, receiving, and otherwise obtaining information from all relevant sources. See more occupations related to this activity.
- Handling and Moving Objects — Using hands and arms in handling, installing, positioning, and moving materials, and manipulating things. See more occupations related to this activity.
- Identifying Objects, Actions, and Events — Identifying information by categorizing, estimating, recognizing differences or similarities, and detecting changes in circumstances or events. See more occupations related to this activity.
- Monitor Processes, Materials, or Surroundings — Monitoring and reviewing information from materials, events, or the environment, to detect or assess problems
- Fabricate parts or components. See more occupations related to this activity.
- Measure materials or objects for installation or assembly. See more occupations related to this activity.
- Position construction or extraction equipment. See more occupations related to this activity.
- Test electrical equipment or systems to ensure proper functioning. See more occupations related to this activity.
- Clean work sites.
Work Context
- Face-to-Face Discussions — 99% responded “Every day.” See more occupations related to this work context.
- Spend Time Standing — 67% responded “Continually or almost continually.” See more occupations related to this work context.
- Spend Time Using Your Hands to Handle, Control, or Feel Objects, Tools, or Controls — 66% responded “Continually or almost continually.” See more occupations related to this work context.
- Importance of Being Exact or Accurate — 66% responded “Extremely important.” See more occupations related to this work context.
- Wear Common Protective or Safety Equipment such as Safety Shoes, Glasses, Gloves, Hearing Protection, Hard Hats, or Life Jackets — 68% responded “Every day”.
Interests
Interest code: RC
- Realistic — Realistic occupations frequently involve work activities that include practical, hands-on problems, and solutions. They often deal with plants, animals, and real-world materials like wood, tools, and machinery. Many of the occupations require working outside and do not involve a lot of paperwork or working closely with others. See more occupations related to this interest.
- Conventional — Conventional occupations frequently involve following set procedures and routines. These occupations can include working with data and details more than with ideas. Usually, there is a clear line of authority to follow.
Work Styles
- Attention to Detail — Job requires being careful about detail and thorough in completing work tasks. See more occupations related to this work style.
- Dependability — Job requires being reliable, responsible, and dependable, and fulfilling obligations. See more occupations related to this work style.
- Innovation — Job requires creativity and alternative thinking to develop new ideas for and answers to work-related problems. See more occupations related to this work style.
- Concern for Others — Job requires being sensitive to others’ needs and feelings and being understanding and helpful on the job. See more occupations related to this work style.
- Integrity — Job requires being honest and ethical.
Work Values
- Support — Occupations that satisfy this work value offer supportive management that stands behind employees. Corresponding needs are Company Policies, Supervision: Human Relations, and Supervision: Technical. See more occupations related to this work value.
- Relationships — Occupations that satisfy this work value allow employees to provide service to others and work with co-workers in a friendly non-competitive environment. Corresponding needs are Co-workers, Moral Values, and Social Service. See more occupations related to this work value.
- Working Conditions — Occupations that satisfy this work value offer job security and good working conditions. Corresponding needs are Activity, Compensation, Independence, Security, Variety, and Working Conditions.
Performance Measures
Internal Key Performance Indicators (Sources: Internal data collections, and Post-Graduate Surveys)
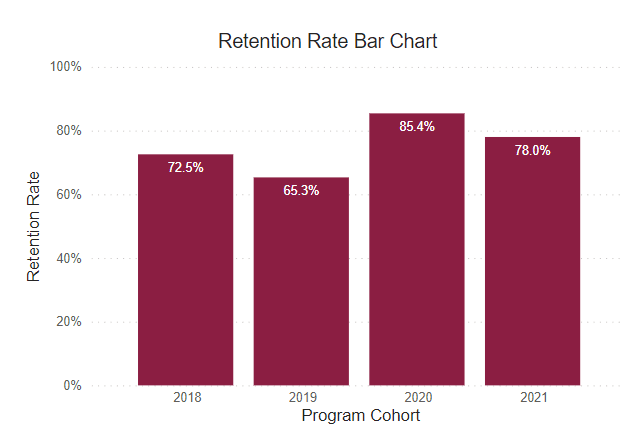
Retention Rate
This rate reflects the continuous term-to-term persistence rate for certificate programs and the fall-to-fall retention rate for associate degree programs.
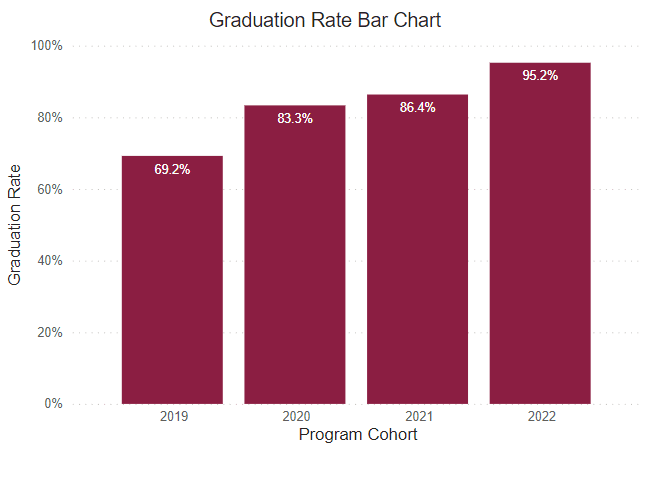
Graduation Rate
This rate reflects the number of freshmen who were officially enrolled in the fall semester and earned a certificate or degree within the expected timeframe.
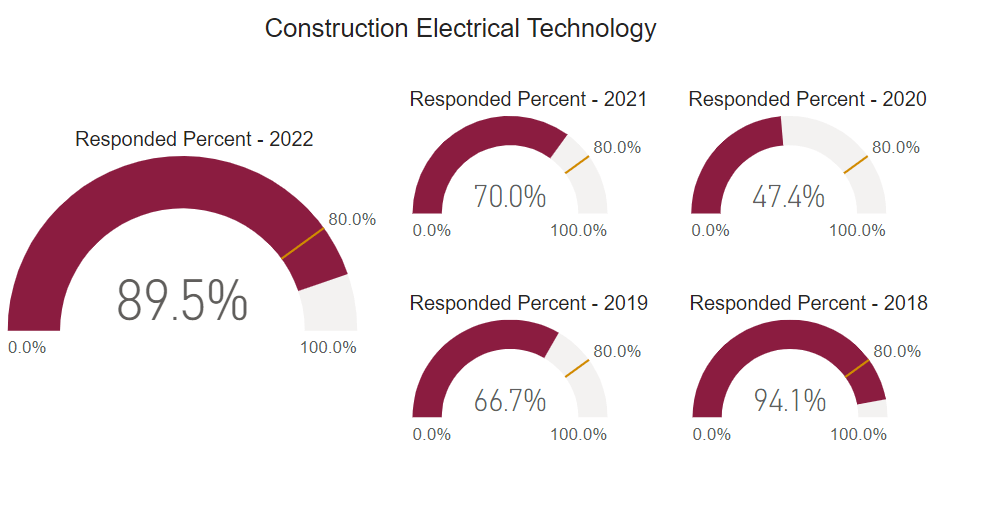
Post Graduate Survey Response Rate
The post graduate survey is an annual on-line post graduate survey utilized by the college to gather vital information regarding career placement, starting salary, and level of satisfaction.

Employed Full Time Outside of Major
Percentage of graduates who reported being employed full-time outside their field of study.
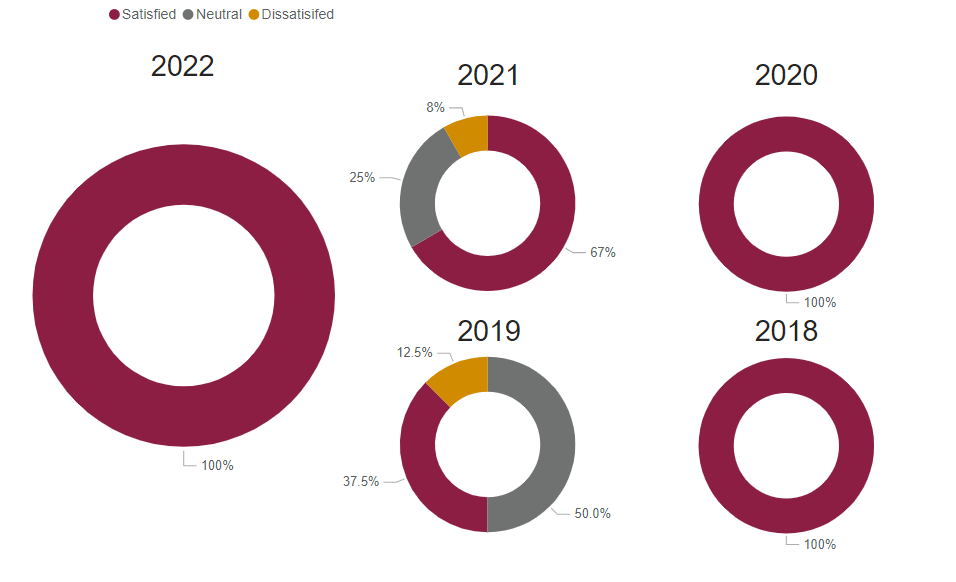
Graduate Satisfaction
This is the median graduate survey response evaluating the level of preparation for workforce entry (based on a 5-Item Likert Scale).
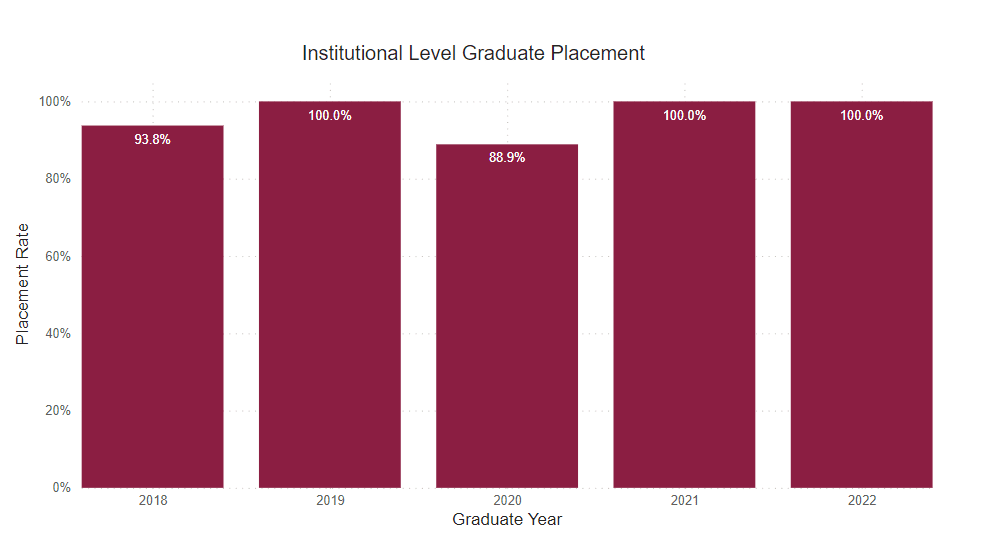
Placement Rate
This is the percent of graduate survey respondents who reported being employed or continued their education on a full-time basis.
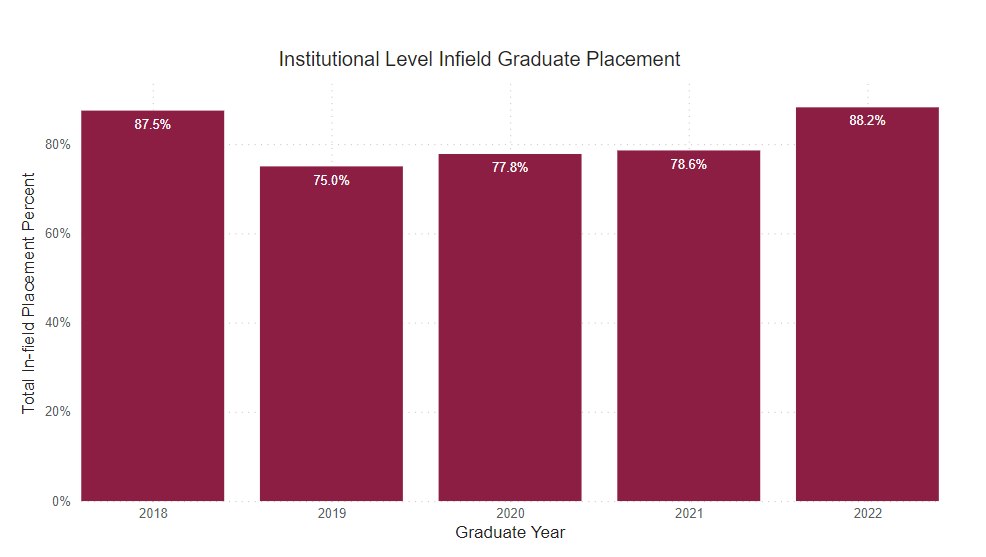
Employed Full Time Within Major
Percentage of graduates who reported being employed full-time within their field of study.
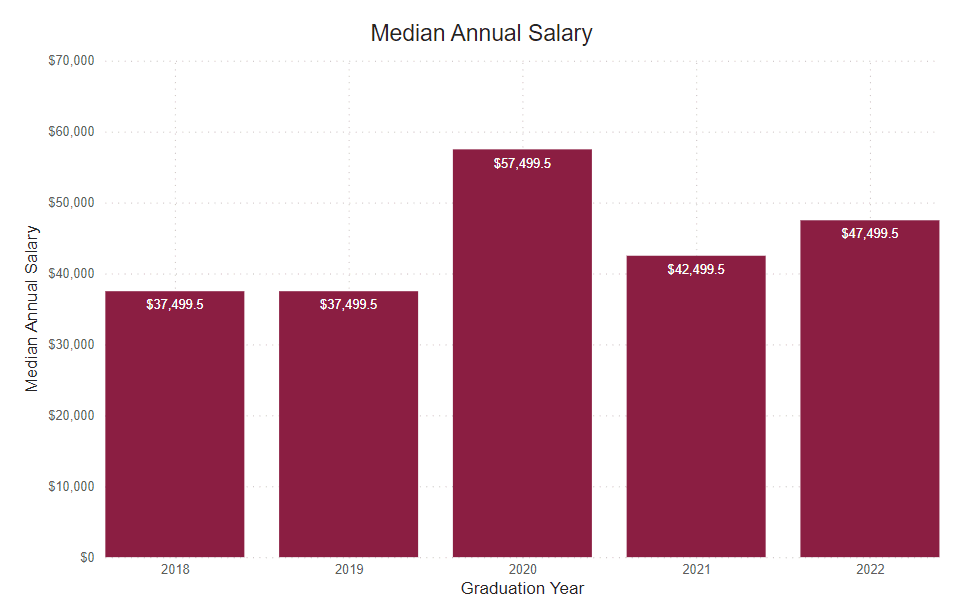
Annual Median Starting Salary
This number is based on the graduate survey response to the request to identify a starting salary from a range of options. This graph shows the median first-year annual salary. All calculations are based on the respondent’s self-reported first-year annual income.
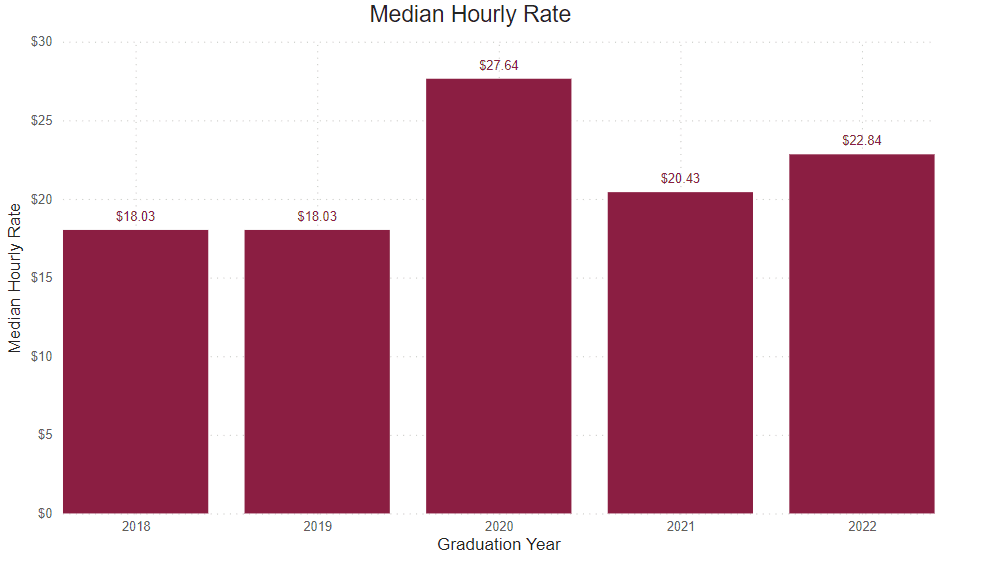
Reported Hourly Rate
This number is determined by dividing the reported median salary by the number of hours in a traditional full-time work week (40), then the number of weeks in a year (52).

Our graduates work with the industry’s best