Automotive Technology
Get started today
About Automotive Technology
Automotive Technology is designed to give students a basic understanding of automotive construction, theory of operation, and standard industry service and repair procedures. This instruction gives them not only the knowledge to perform vehicle service but to develop the skills necessary to diagnose unit malfunctions. Two of the most important skills that will be developed are problem solving and critical thinking.
Thaddeus Stevens College of Technology is ranked No. 10 on Best Accredited Colleges’ list of Best Associate Degrees in Automotive Technology in its 2022 rankings.
What you’ll learn
- Diagnose and repair common malfunctions of the following automotive systems: engine lubrication and cooling; brake, suspension, steering, wheels and tires, electrical (including wiring, batteries, starting, charging, and ignition), fuel, onboard electronics/computers, and engine assemblies; and power train components including manual and automatic transmissions and transaxles.
- Develop the knowledge and skills to operate the latest generation of computerized test and diagnostic equipment, including digital storage lab scopes, onboard scan tools, and a chassis dynamometer, as well as develop skills in the safe operation of a chassis dynamometer.
- Develop sound, basic, and safe automotive shop practice skills, including environmental protection.
- Develop good basic shop habits, including demonstrating a good attendance record, punctuality, a willingness to work, and an ability to work with others as a team.
- Apply basic laws of physics/scientific principles to automotive systems and components when performing in-shop testing exercises and diagnosing problems. This includes exam questions containing diagnostic questions.
- Record diagnostic testing data and reports using necessary mathematics; solve basic problems using elementary algebra.
- Locate and interpret technical data represented in shop repair manuals, diagnostic charts, and wiring diagrams. This data will be in hard print and/or various electronic media sources.
- Demonstrate good automotive shop management practices, including student management, customer relations, shop procedures, and writing repair orders.
- Prepare to take and pass the ASE automotive tests series after successful completion of this program and having at least one additional year of on-the-job experience in the particular area or areas that will be tested.
- Prepare to accept the challenge of continuous training in the automotive field, that is, learning to learn, which will be necessary to adapt to new technologies and to become a problem solver and a critical thinker.
- Obtain the Pennsylvania Auto Safety Inspection Certificate and the Pennsylvania Emissions tester certificate.
Sample Job Titles
Automobile Mechanic (Auto Mechanic), Automotive Drivability Technician (Auto Drivability Tech), Automotive Mechanic (Auto Mechanic), Automotive Service Technician (Auto Service Tech), Heavy Line Technician, Lube Technician, Master Automotive Technician (Master Auto Tech), Mechanic, Quick Service Technician (Quick Service Tech), Service Technician (Service Tech).
Quick facts
Location
Thaddeus Stevens College Transportation Center
Type of program
Associate Degree
Job/Salary Outlook
See industry data
Cost of program
$4,500/semester tuition
$3,000 – $3,500/semester housing
$1,850 – $2,335/semester meal plan
Tools List
Download PDF

The outcomes speak for themselves
This program gives students not only the knowledge to perform vehicle service but to develop the skills necessary to diagnose unit malfunctions.
100%
employment
$47.5K
med. salary
People of TSCT
Success stories

Program details
Courses
MODEL SCHEDULE FOR AUTOMOTIVE TECHNOLOGY
Semester 1
- AUTO 106 – Automotive Service Fundamentals (2 credits)
- AUTO 111 – Internal Combustion Engine Service (4 credits)
- AUTO 116 – Chassis Service/Steering & Suspension (3 credits)
- MATH 126 – Technical Math I (or higher) (3 credits)
- CIS 111 – Intro to Computer Applications (3 credits)
Semester 2
- AUTO 156 – Automotive Brake Systems (3 credits)
- AUTO 161 – Automotive Electrical/Electronic Principles (4 credits)
- AUTO 166 – Engine Electrical/Electronic Principles (4 credits)
- AUTO171 – Fuel and Emission Systems (4 credits)
- PHYS 106 – Physics for Everyday Life (or higher) (3 credits)
- ENG 106 – English Composition (3 credits)
Semester 3
- AUTO 206 – Advanced Engine Diagnosis (3 credits)
- AUTO 211 – Advanced Chassis Service (3 credits)
- AUTO 216 – Independent Diagnosis and Repair (3 credits
- AUTO 223 – Pennsylvania Safety Inspection/Enhanced Emissions Inspection Certification (3 credits)
- ENG 221 – Public Speaking, OR (3 credits)
- ENG 216 – Technical Writing* (3 credits)
- Humanities Elective (3 credits)
Semester 4
- AUTO 256 – Heating and Air Conditioning (2 credits)
- AUTO 261 – Drive Train and Manual Transaxle Service (3 credits)
- AUTO 266 – Advanced Engine Computer Control Analysis (3 credits)
- AUTO 271 – Automatic Transaxle Service (4 credits)
- AUTO 276 – Fuel Injection Systems (3 credits)
Additional General Education Requirements
- HEAL Elective HEAL 106 or HEAL 111 (1 credit)
- Elective – General Studies Elective (3 credits)
- Elective – General Studies Elective (3 credits
Total Credits 76
Faculty
Occupational Advisory Committee
The Occupational Advisory Committee (OAC) serves as a vital link between the Program of study and industry, ensuring that the program remains aligned with current workforce needs, technological advancements, and best practices in the field. Composed of employers, educators, and other community members, the committee provides guidance, feedback, and recommendations to enhance the curriculum, instructional methods, and student learning experiences.
Purpose and Responsibilities:
- Curriculum & Industry Alignment
- Workforce Readiness
- Student & Faculty Support
- Internship & Employment Connections
- Accreditation & Program Evaluation
- Facilities & Equipment Recommendations
By fostering a strong relationship between academia and industry, the OAC helps ensure that Thaddeus Stevens College programs maintain the highest standards in CTE (career and technical education).
- Duane Bushong, Arconic
- Jade Malehorn, Apple Automotive
Essential Skills Learned
Tasks
- Test drive vehicles and test components and systems, using equipment such as infrared engine analyzers, compression gauges, and computerized diagnostic devices.
- Inspect vehicles for damage and record findings so that necessary repairs can be made.
- Test and adjust repaired systems to meet manufacturers’ performance specifications.
- Repair, reline, replace, and adjust brakes.
- Estimate costs of vehicle repair.
- Review work orders and discuss work with supervisors.
- Troubleshoot fuel, ignition, and emissions control systems, using electronic testing equipment.
- Confer with customers to obtain descriptions of vehicle problems and to discuss work to be performed and future repair requirements.
- Align vehicles’ front ends.
Tools used in this occupation
- Hammers — 5-pound sledgehammers; Brass hammers; Soft face hammers; Wheel weight hammers
- Organic light-emitting displays — Anti-lock braking system ABS/airbag scan tools; Auto scanners; Modular diagnostic information systems; Scan tools
- Pullers — Bearing pullers; Gear pullers; Hand pullers; Power pullers
- Specialty wrenches — Breaker bars; Chain wrenches; Locking wrenches; Ratcheting gear wrenches
- Voltage or current meters — Alternating current/direct current AC/DC inductive current clamps; In-line ignition spark testers; Spark plug testers; Voltmeters
Technology used in this occupation
- Analytical or scientific software — Blue Streak Electronics Buell Diagnostic; CODA Engine Analysis System; Nexiq Tech HDS Suite for Palm; SPX/OTC Genisys; ConnecTech PC
- Database user interface and query software — Data entry software; Database software; Recordkeeping software; Work order management software
- Electronic mail software — IBM Notes; Microsoft Outlook
- Facilities management software — Alliance Automotive Shop Controller; Amcom AUTOS2000; Scott Systems MaxxTraxx Pro; Snap-On ShopKey
- Video creation and editing software — YouTube
Knowledge
- Mechanical — Knowledge of machines and tools, including their designs, uses, repair, and maintenance.
- Customer and Personal Service — Knowledge of principles and processes for providing customer and personal services. This includes customer needs assessment, meeting quality standards for services, and evaluation of customer satisfaction.
- Computers and Electronics — Knowledge of circuit boards, processors, chips, electronic equipment, and computer hardware and software, including applications and programming.
- English Language — Knowledge of the structure and content of the English language including the meaning and spelling of words, rules of composition, and grammar.
- Engineering and Technology — Knowledge of the practical application of engineering science and technology. This includes applying principles, techniques, procedures, and equipment to the design and production of various goods and services.
Skills
- Repairing — Repairing machines or systems using the needed tools.
- Troubleshooting — Determining causes of operating errors and deciding what to do about it.
- Operation Monitoring — Watching gauges, dials, or other indicators to make sure a machine is working properly.
- Equipment Maintenance — Performing routine maintenance on equipment and determining when and what kind of maintenance is needed.
- Operation and Control — Controlling operations of equipment or systems.
- Critical Thinking — Using logic and reasoning to identify the strengths and weaknesses of alternative solutions, conclusions, or approaches to problems.
- Quality Control Analysis — Conducting tests and inspections of products, services, or processes to evaluate quality or performance.
- Equipment Selection — Determining the kind of tools and equipment needed to do a job
Abilities
- Arm-Hand Steadiness — The ability to keep your hand and arm steady while moving your arm or while holding your arm and hand in one position.
- Control Precision — The ability to quickly and repeatedly adjust the controls of a machine or a vehicle to exact positions.
- Finger Dexterity — The ability to make precisely coordinated movements of the fingers of one or both hands to grasp, manipulate, or assemble very small objects.
- Manual Dexterity — The ability to quickly move your hand, your hand together with your arm, or your two hands to grasp, manipulate, or assemble objects.
- Near Vision — The ability to see details at close range (within a few feet of the observer).
- Multilimb Coordination — The ability to coordinate two or more limbs (for example, two arms, two legs, or one leg and one arm) while sitting, standing, or lying down. It does not involve performing the activities while the whole body is in motion.
- Deductive Reasoning — The ability to apply general rules to specific problems to produce answers that make sense.
- Extent Flexibility — The ability to bend, stretch, twist, or reach with your body, arms, and/or legs.
- Inductive Reasoning — The ability to combine pieces of information to form general rules or conclusions (includes finding a relationship among seemingly unrelated events).
Work Activities
- Getting Information — Observing, receiving, and otherwise obtaining information from all relevant sources.
- Making Decisions and Solving Problems — Analyzing information and evaluating results to choose the best solution and solve problems.
- Operating Vehicles, Mechanized Devices, or Equipment — Running, maneuvering, navigating, or driving vehicles or mechanized equipment, such as forklifts, passenger vehicles, aircraft, or watercraft.
- Updating and Using Relevant Knowledge — Keeping up-to-date technically and applying new knowledge to your job.
- Identifying Objects, Actions, and Events — Identifying information by categorizing, estimating, recognizing differences or similarities, and detecting changes in circumstances or events.
- Repairing and Maintaining Mechanical Equipment — Servicing, repairing, adjusting, and testing machines, devices, moving parts, and equipment that operate primarily on the basis of mechanical (not electronic) principles.
- Handling and Moving Objects — Using hands and arms in handling, installing, positioning, and moving materials, and manipulating things.
- Inspecting Equipment, Structures, or Material — Inspecting equipment, structures, or materials to identify the cause of errors or other problems or defects.
- Performing General Physical Activities — Performing physical activities that require considerable use of your arms and legs and moving your whole body, such as climbing, lifting, balancing, walking, stooping, and handling of materials.
Work Context
- Exposed to Contaminants — How often does this job require working exposed to contaminants (such as pollutants, gases, dust, or odors)?
- Sounds, Noise Levels Are Distracting or Uncomfortable — How often does this job require working exposed to sounds and noise levels that are distracting or uncomfortable?
- Spend Time Using Your Hands to Handle, Control, or Feel Objects, Tools, or Controls — How much does this job require using your hands to handle, control, or feel objects, tools, or controls?
- In an Enclosed Vehicle or Equipment — How often does this job require working in a closed vehicle or equipment (e.g., car)?
- Spend Time Standing — How much does this job require standing?
- Time Pressure — How often does this job require the worker to meet strict deadlines?
- Wear Common Protective or Safety Equipment such as Safety Shoes, Glasses, Gloves, Hearing Protection, Hard Hats, or Life Jackets — How much does this job require wearing common protective or safety equipment such as safety shoes, glasses, gloves, hard hats or life jackets?
- Face-to-Face Discussions — How often do you have to have face-to-face discussions with individuals or teams in this job?
- Frequency of Decision Making — How frequently is the worker required to make decisions that affect other people, the financial resources, and/or the image and reputation of the organization?
Interests
- Realistic — Realistic occupations frequently involve work activities that include practical, hands-on problems and solutions. They often deal with plants, animals, and real-world materials like wood, tools, and machinery. Many of the occupations require working outside, and do not involve a lot of paperwork or working closely with others.
- Investigative — Investigative occupations frequently involve working with ideas and require an extensive amount of thinking. These occupations can involve searching for facts and figuring out problems mentally.
- Conventional — Conventional occupations frequently involve following set procedures and routines. These occupations can include working with data and details more than with ideas. Usually, there is a clear line of authority to follow.
Work Styles
- Attention to Detail — Job requires being careful about detail and thorough in completing work tasks.
- Dependability — Job requires being reliable, responsible, and dependable, and fulfilling obligations.
- Integrity — Job requires being honest and ethical.
- Persistence — Job requires persistence in the face of obstacles.
- Independence — Job requires developing one’s own ways of doing things, guiding oneself with little or no supervision, and depending on oneself to get things done.
- Initiative — Job requires a willingness to take on responsibilities and challenges.
- Achievement/Effort — Job requires establishing and maintaining personally challenging achievement goals and exerting effort toward mastering tasks.
- Analytical Thinking — Job requires analyzing information and using logic to address work-related issues and problems.
- Self-Control — Job requires maintaining composure, keeping emotions in check, controlling anger, and avoiding aggressive behavior, even in very difficult situations.
Work Values
- Support — Occupations that satisfy this work value offer supportive management that stands behind employees. Corresponding needs are Company Policies, Supervision: Human Relations and Supervision: Technical.
- Independence — Occupations that satisfy this work value allow employees to work on their own and make decisions. Corresponding needs are Creativity, Responsibility, and Autonomy.
- Relationships — Occupations that satisfy this work value allow employees to provide service to others and work with co-workers in a friendly non-competitive environment. Corresponding needs are Co-workers, Moral Values, and Social Service.
Performance Measures
Internal Key Performance Indicators (Sources: Internal data collections, and Post-Graduate Surveys)
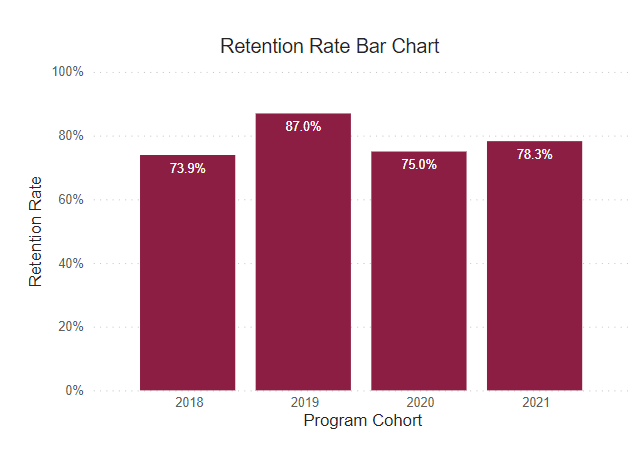
Retention Rate
This rate reflects the continuous term-to-term persistence rate for certificate programs and the fall-to-fall retention rate for associate degree programs.
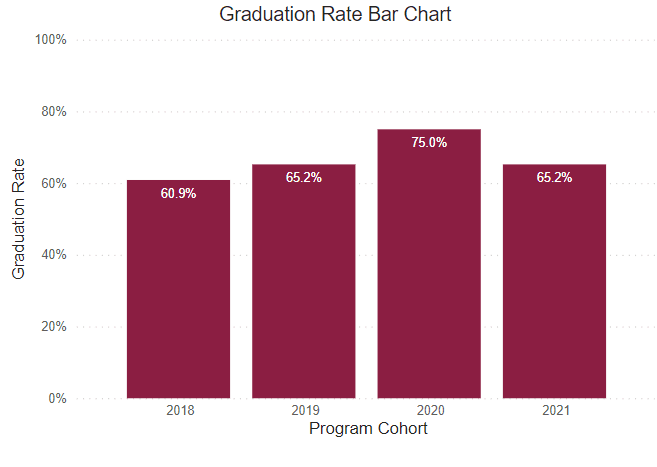
Graduation Rate
This rate reflects the number of freshmen who were officially enrolled in the fall semester and earned a certificate or degree within the expected timeframe.
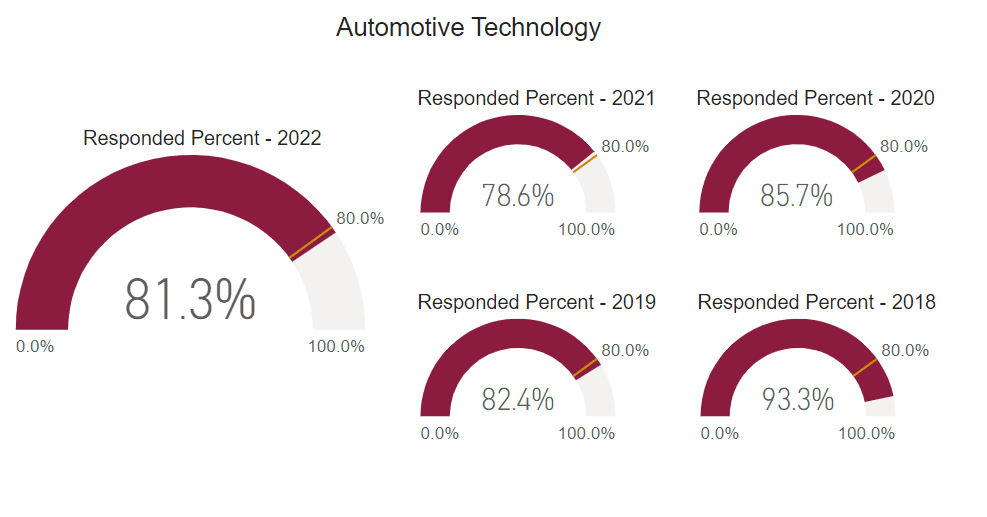
Post Graduate Survey Response Rate
The post graduate survey is an annual on-line post graduate survey utilized by the college to gather vital information regarding career placement, starting salary, and level of satisfaction.
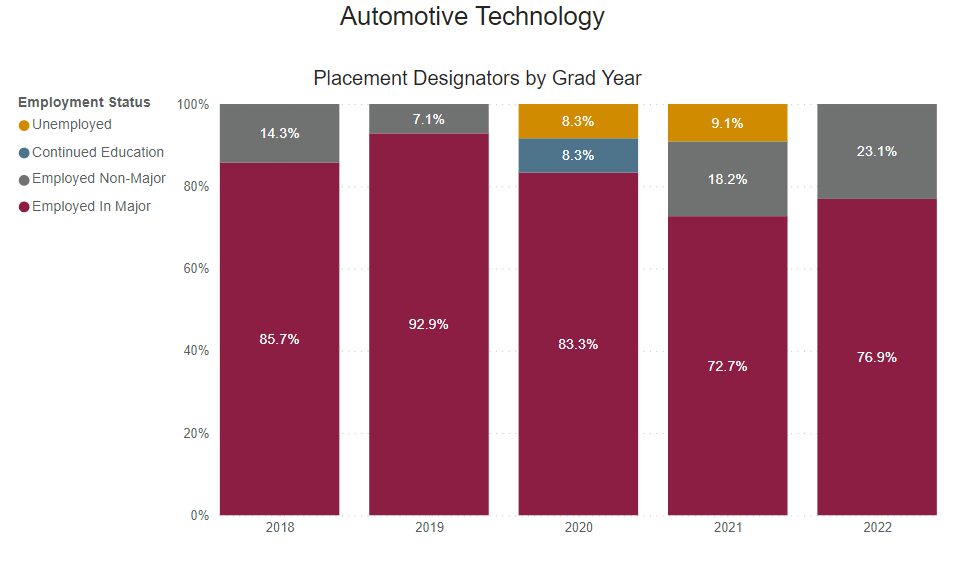
Employed Full Time Outside of Major
Percentage of graduates who reported being employed full-time outside their field of study.
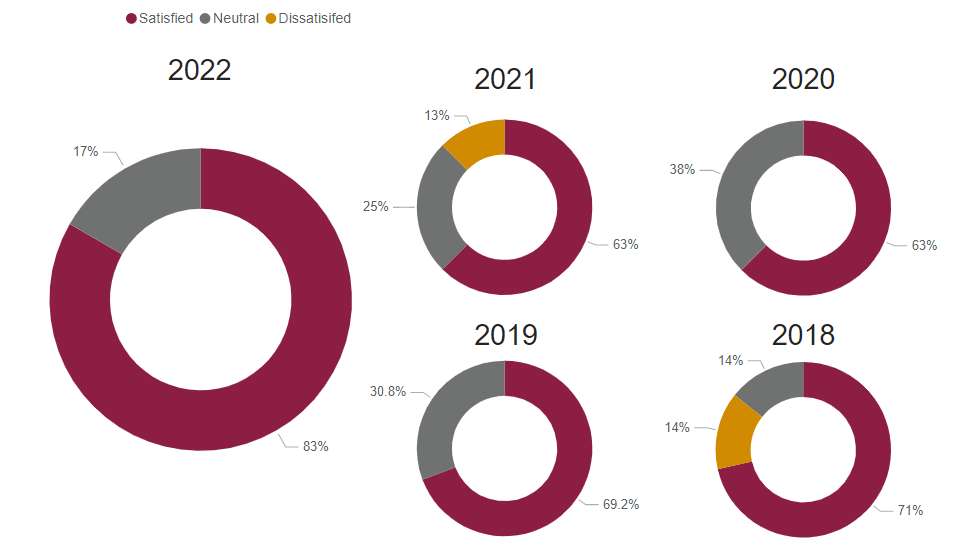
Graduate Satisfaction
This is the median graduate survey response evaluating the level of preparation for workforce entry (based on a 5-Item Likert Scale).
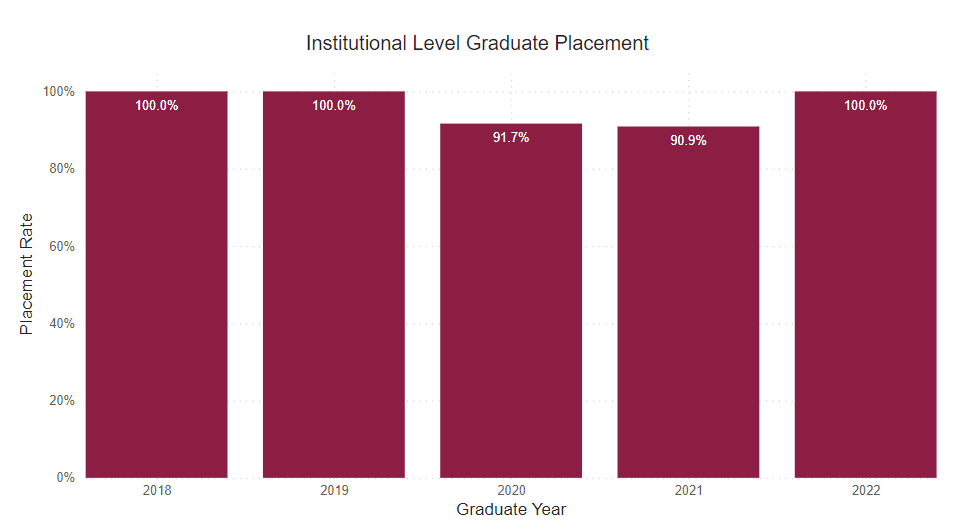
Placement Rate
This is the percent of graduate survey respondents who reported being employed or continued their education on a full-time basis.
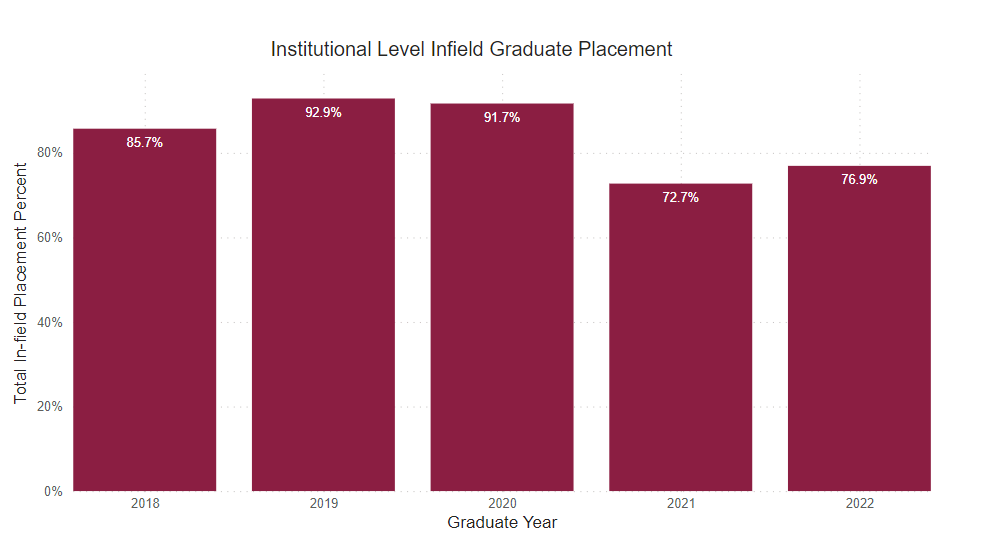
Employed Full Time Within Major
Percentage of graduates who reported being employed full-time within their field of study.
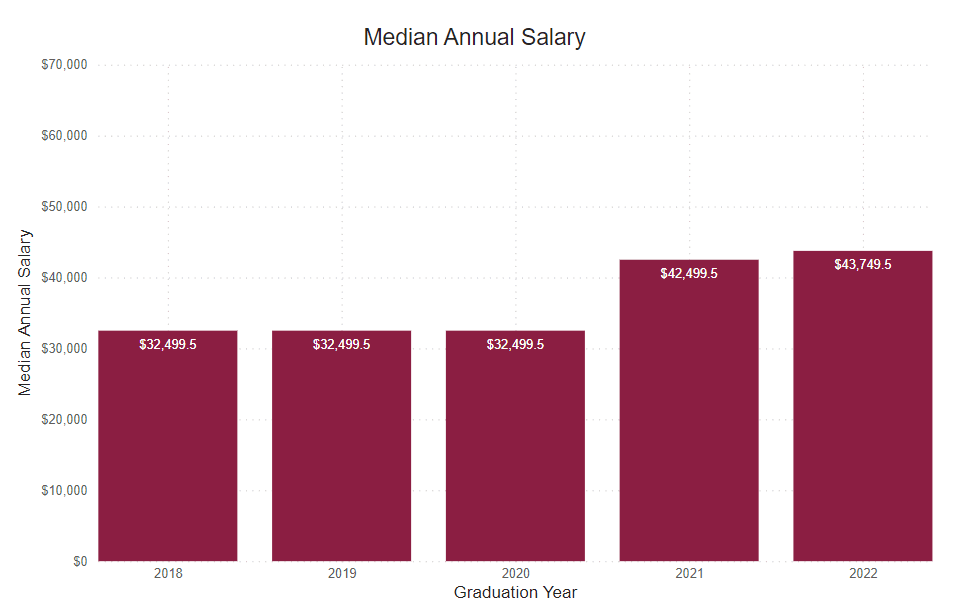
Annual Median Starting Salary
This number is based on the graduate survey response to the request to identify a starting salary from a range of options. This graph shows the median first-year annual salary. All calculations are based on the respondent’s self-reported first-year annual income.
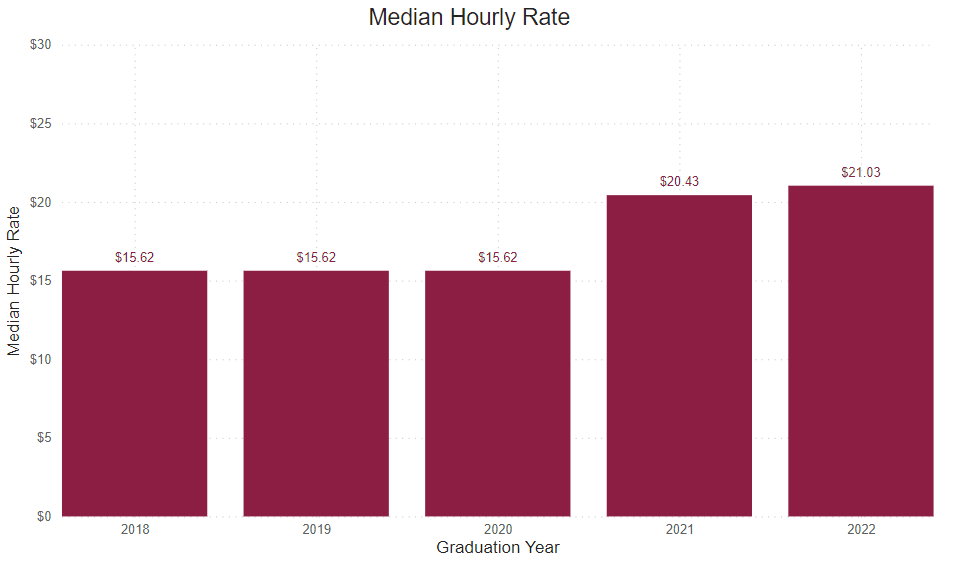
Reported Hourly Rate
This number is determined by dividing the reported median salary by the number of hours in a traditional full-time work week (40), then the number of weeks in a year (52).

Our graduates work with the industry’s best


