
Business Administration
Get started today
About Business Administration
All employers need highly skilled business personnel to keep their operations running smoothly and successfully. Dynamic careers in business are available in virtually every sector of the economy. Job openings are plentiful, working conditions are comfortable, and opportunities for advancement are within reach for those with a two-year degree.
The Business Administration program at Thaddeus Stevens College provides students with the marketable skills, academic background, and experience required to meet the needs of the workforce or transfer to a four-year university. The broad-based curriculum is designed to prepare recent high school graduates or those re-entering the workforce to reach their full potential in many varied business fields. Faculty are focused on training students to manage rapidly changing technology, lead and motivate others, prepare and analyze financial information, and succeed in the global marketplace. Entry-level job titles for recent graduates include sales and service account manager, accounts payable and receivable clerk, administrative assistant, public relations coordinator, operations coordinator, small business owner, human resources assistant/specialist, and facility supervisor.
What you’ll learn
- Demonstrate excellent communication skills, including the ability to speak and write clearly and effectively, especially in the business setting.
- Demonstrate an understanding of emerging online technologies and trends and their influence on the electronic commerce marketplace.
- Use critical thinking and mathematical skills to analyze and solve accounting and business math problems.
- Assess and influence behavior among peers, subordinates, and managers; work well as an individual, in groups, and on teams.
- Demonstrate an understanding of the marketer’s tasks and knowledge in the principles of how those tasks can be accomplished.
- Investigate the basic practices and principles involved in the administration of a modern business, and evaluate various career paths that may be pursued.
- Predict managerial success by studying the primary theories, principles, and processes of management.
- Demonstrate an understanding of the judicial process and business law in areas such as leases, contracts and employment law, and how they impact various forms of business organizations.
- Display a general knowledge of the social sciences and understand their effect on the workforce and society.
Sample Job Titles
Administrative Assistant, Administrative Clerk, Administrative Specialist, Administrative Support Assistant, Administrative Technician, Department Secretary, Office Assistant, Bookkeeper, Clerk, Staff Assistant
Quick facts
Location
Griscom Education Center
Type of program
Associate Degree
Job/Salary Outlook
See industry data
Length of program
2 years, 75 credits
Cost of program
$4,500/semester tuition
$3,000 – $3,500/semester housing
$1,850 – $2,335/semester meal plan
Tool List: First-Year, Second-Year (PDF)

The outcomes speak for themselves
Those graduating from the Business Administration program have wide opportunities available to them, as well as easy footing for further education.
50%
employment
$47.5K
med. salary
40%
cont. education
People of TSCT
Success stories

Program details
Courses
MODEL SCHEDULE FOR BUSINESS ADMINISTRATION
Semester 1
- BUAD 117 – Introduction to Business (3 credits)
- BUAD 157 – Principles of Marketing (3 credits)
- BUAD 160 – Principles of Management (3 credits)
- BUAD 166 – Business Computer Applications I (3 credits
- MATH 137 – Intermediate Algebra (or higher-level math) (3 credits)
- BUSN 106 – Small Business Management (3 credits)
Semester 2
- BUAD 190 – Intro to Corporate Finance (3 credits)
- BUAD 180 – Intro to Supply Chain Management (3 credits)
- BUAD 257 – Electronic Commerce (3 credits)
- BUAD 266 – Business Computer Applications II – Data Analytics (3 credits)
- ENG 106 – English Composition (3 credits)
- SCIENCE Elective (3 credits)
Semester 3
- BUAD 201 – Accounting Principles I (4 credits)
- BUAD 214 – Introduction to Law and Business Law (4 credits)
- BUAD 222 – Organizational Behavior (4 credits)
- BUAD 226 – Business Skills Lab (1 credit)
- MATH 150 – Elements of Statistics (3 credits)
- ECON 230 – Microeconomics (3 credits)
Semester 4
- BUAD 251 – Accounting Principles II (4 credits)
- BUAD 268 – Human Resources Management (4 credits)
- BUAD 271 – Business Skills Lab (1 credit)
- BUAD 277 – Business Communications (4 credits)
- ECON 240 – Macroeconomics (3 credits)
- ENG 221 – Public Speaking (3 credits)
Additional General Education Requirements
- HEAL Elective HEAL 106 or HEAL 111 (1 credit)
- ELECTIVE – General Education Elective (3 credits)
Total Credits 75
Faculty
Occupational Advisory Committee
The Occupational Advisory Committee (OAC) serves as a vital link between the Program of study and industry, ensuring that the program remains aligned with current workforce needs, technological advancements, and best practices in the field. Composed of employers, educators, and other community members, the committee provides guidance, feedback, and recommendations to enhance the curriculum, instructional methods, and student learning experiences.
Purpose and Responsibilities:
- Curriculum & Industry Alignment
- Workforce Readiness
- Student & Faculty Support
- Internship & Employment Connections
- Accreditation & Program Evaluation
- Facilities & Equipment Recommendations
By fostering a strong relationship between academia and industry, the OAC helps ensure that Thaddeus Stevens College programs maintain the highest standards in CTE (career and technical education).
- Madonna Arntz, Armstrong World Industries
- Yvonne DeSalle, The YGS Group
- Scott Dolor, M. Davis & Sons
- Dakota Ford, Clark Service Group, Inc.
- Kimberly Garland, CAMCO
- Leon Good, Weaver Industries, Inc.
- Angie Hessen, High Company LLC
- Shayne Klopp, Health Insurance Alliance
- Jamie Nerys, ICF
- Shawn Pettis, BGA Industries
- Kristyne Schonhaut, PSECU
- Steven Seepaul, Fowler Hirtzel McNulty & Spaulding, LLC
- Bryan Weathers, Allegiance Staffing
- Robert Zedaker, Grafika Commercial Printing
Essential Skills Learned
Tasks
- Demonstrate excellent communication skills, including the ability to speak and write clearly and effectively, especially in the business setting.
- Demonstrate an understanding of emerging online technologies and trends and their influence on the electronic commerce marketplace.
- Use critical thinking and mathematical skills to analyze and solve accounting and business math problems.
- Demonstrate advanced keyboarding skills as well as spreadsheet, database management, word processing, and presentation applications.
- Assess and influence behavior among peers, subordinates, and managers; work well as an individual, in groups, and on teams.
- Demonstrate an understanding of the marketer’s tasks and knowledge in the principles of how those tasks can be accomplished.
- Investigate the basic practices and principals involved in the administration of a modern business, and evaluate various career paths that may be pursued.
- Predict managerial success by studying the primary theories, principals, and processes of management.
- Demonstrate an understanding of the judicial process and business law in areas such as leases, contracts and employment law, and how they impact various forms of business organizations.
- Display a general knowledge of the social sciences and understand their effect on the workforce and society.
Tools used in this occupation
- Notebook computers — Laptop computers
- Photocopiers — Photocopying equipment
- Scanners — Data input scanners
- Special purpose telephones — Multi-line telephone systems
Technology used in this occupation
- Accounting software — IBM Maximo Asset Management; Intuit QuickBooks software
- Database user interface and query software — Database software; FileMaker Pro software; Microsoft Access
- Electronic mail software — Email software; Microsoft Outlook
- Graphics or photo imaging software — Adobe Systems Adobe Photoshop software; Graphics software
- Internet browser software — Mozilla Firefox *; Web browser software
Knowledge
- Administration and Management — Knowledge of business and management principles involved in strategic planning, resource allocation, human resources modeling, leadership technique, production methods, and coordination of people and resources.
- English Language — Knowledge of the structure and content of the English language including the meaning and spelling of words, rules of composition, and grammar.
- Computers and Electronics — Knowledge of circuit boards, processors, chips, electronic equipment, and computer hardware and software, including applications and programming.
- Customer and Personal Service — Knowledge of principles and processes for providing customer and personal services. This includes customer needs assessment, meeting quality standards for services, and evaluation of customer satisfaction.
Skills
- Active Listening — Giving full attention to what other people are saying, taking time to understand the points being made, asking questions as appropriate, and not interrupting at inappropriate times.
- Speaking — Talking to others to convey information effectively.
- Reading Comprehension — Understanding written sentences and paragraphs in work-related documents.
- Writing — Communicating effectively in writing as appropriate for the needs of the audience.
- Service Orientation — Actively looking for ways to help people.
- Time Management — Managing one’s own time and the time of others.
- Coordination — Adjusting actions in relation to others’ actions.
- Monitoring — Monitoring/Assessing performance of yourself, other individuals, or organizations to make improvements or take corrective action.
- Critical Thinking — Using logic and reasoning to identify the strengths and weaknesses of alternative solutions, conclusions, or approaches to problems.
Abilities
- Oral Comprehension — The ability to listen to and understand information and ideas presented through spoken words and sentences.
- Oral Expression — The ability to communicate information and ideas in speaking so others will understand.
- Written Comprehension — The ability to read and understand information and ideas presented in writing.
- Written Expression — The ability to communicate information and ideas in writing so others will understand.
- Near Vision — The ability to see details at close range (within a few feet of the observer).
- Speech Clarity — The ability to speak clearly so others can understand you.
- Speech Recognition — The ability to identify and understand the speech of another person.
- Information Ordering — The ability to arrange things or actions in a certain order or pattern according to a specific rule or set of rules (e.g., patterns of numbers, letters, words, pictures, mathematical operations).
- Problem Sensitivity — The ability to tell when something is wrong or is likely to go wrong. It does not involve solving the problem, only recognizing there is a problem.
Work Activities
- Interacting With Computers — Using computers and computer systems (including hardware and software) to program, write software, set up functions, enter data, or process information.
- Communicating with Supervisors, Peers, or Subordinates — Providing information to supervisors, co-workers, and subordinates by telephone, in written form, e-mail, or in person.
- Getting Information — Observing, receiving, and otherwise obtaining information from all relevant sources.
- Performing Administrative Activities — Performing day-to-day administrative tasks such as maintaining information files and processing paperwork.
- Establishing and Maintaining Interpersonal Relationships — Developing constructive and cooperative working relationships with others, and maintaining them over time.
- Organizing, Planning, and Prioritizing Work — Developing specific goals and plans to prioritize, organize, and accomplish your work.
- Documenting/Recording Information — Entering, transcribing, recording, storing, or maintaining information in written or electronic/magnetic form.
- Communicating with Persons Outside Organization — Communicating with people outside the organization, representing the organization to customers, the public, government, and other external sources. This information can be exchanged in person, in writing, or by telephone or e-mail.
- Evaluating Information to Determine Compliance with Standards — Using relevant information and individual judgment to determine whether events or processes comply with laws, regulations, or standards.
- Identifying Objects, Actions, and Events — Identifying information by categorizing, estimating, recognizing differences or similarities, and detecting changes in circumstances or events.
- Processing Information — Compiling, coding, categorizing, calculating, tabulating, auditing, or verifying information or data.
Interests
- Conventional — Conventional occupations frequently involve following set procedures and routines. These occupations can include working with data and details more than with ideas. Usually, there is a clear line of authority to follow.
- Enterprising — Enterprising occupations frequently involve starting up and carrying out projects. These occupations can involve leading people and making many decisions. Sometimes they require risk-taking and often deal with business.
Work Styles
- Attention to Detail — Job requires being careful about detail and thorough in completing work tasks.
- Integrity — Job requires being honest and ethical.
- Cooperation — Job requires being pleasant with others on the job and displaying a good-natured, cooperative attitude.
- Dependability — Job requires being reliable, responsible, and dependable, and fulfilling obligations.
- Concern for Others — Job requires being sensitive to others’ needs and feelings and being understanding and helpful on the job.
- Self-Control — Job requires maintaining composure, keeping emotions in check, controlling anger, and avoiding aggressive behavior, even in very difficult situations.
- Adaptability/Flexibility — Job requires being open to change (positive or negative) and to considerable variety in the workplace.
- Stress Tolerance — Job requires accepting criticism and dealing calmly and effectively with high-stress situations.
- Independence — Job requires developing one’s own ways of doing things, guiding oneself with little or no supervision, and depending on oneself to get things done.
- Achievement/Effort — Job requires establishing and maintaining personally challenging achievement goals and exerting effort toward mastering tasks.
Work Values
- Support — Occupations that satisfy this work value offer supportive management that stands behind employees. Corresponding needs are Company Policies, Supervision: Human Relations and Supervision: Technical.
- Relationships — Occupations that satisfy this work value allow employees to provide service to others and work with co-workers in a friendly non-competitive environment. Corresponding needs are Co-workers, Moral Values, and Social Service.
- Working Conditions — Occupations that satisfy this work value offer job security and good working conditions. Corresponding needs are Activity, Compensation, Independence, Security, Variety, and Working Conditions.
Performance Measures
Internal Key Performance Indicators (Sources: Internal data collections, and Post-Graduate Surveys)
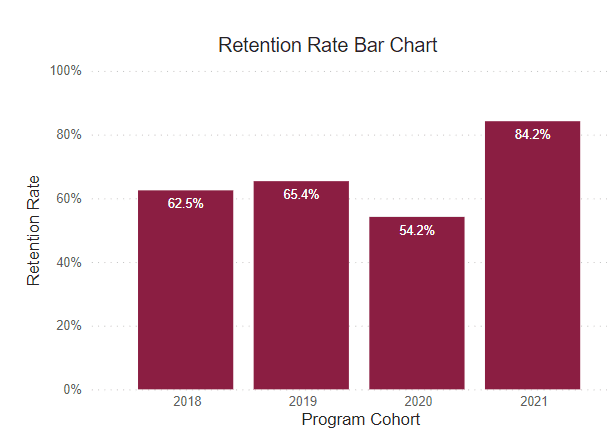
Retention Rate
This rate reflects the continuous term-to-term persistence rate for certificate programs and the fall-to-fall retention rate for associate degree programs.
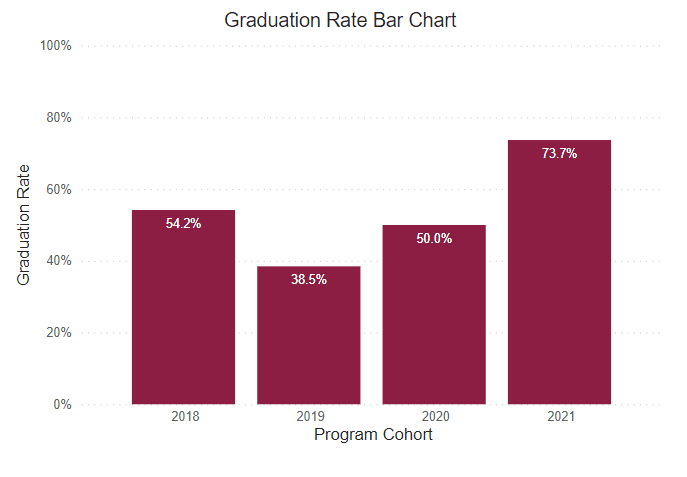
Graduation Rate
This rate reflects the number of freshmen who were officially enrolled in the fall semester and earned a certificate or degree within the expected timeframe.
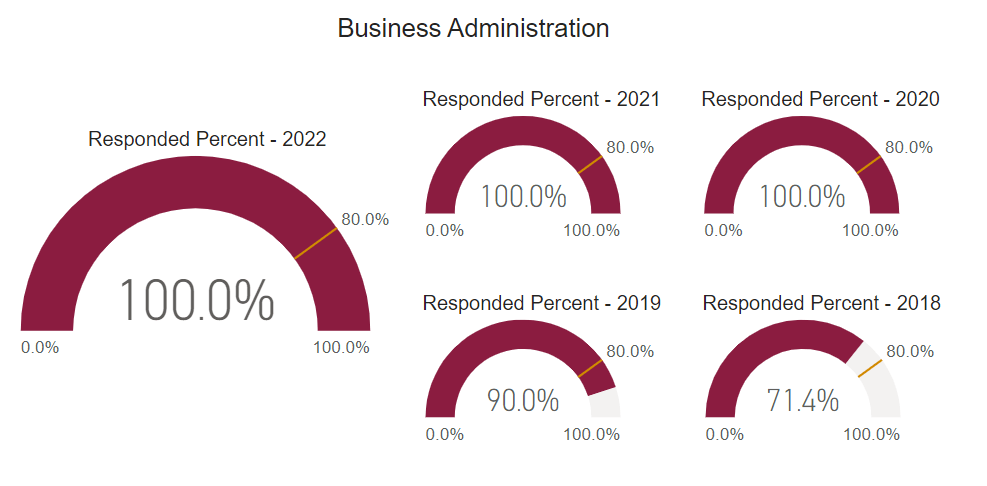
Post Graduate Survey Response Rate
The post graduate survey is an annual on-line post graduate survey utilized by the college to gather vital information regarding career placement, starting salary, and level of satisfaction.
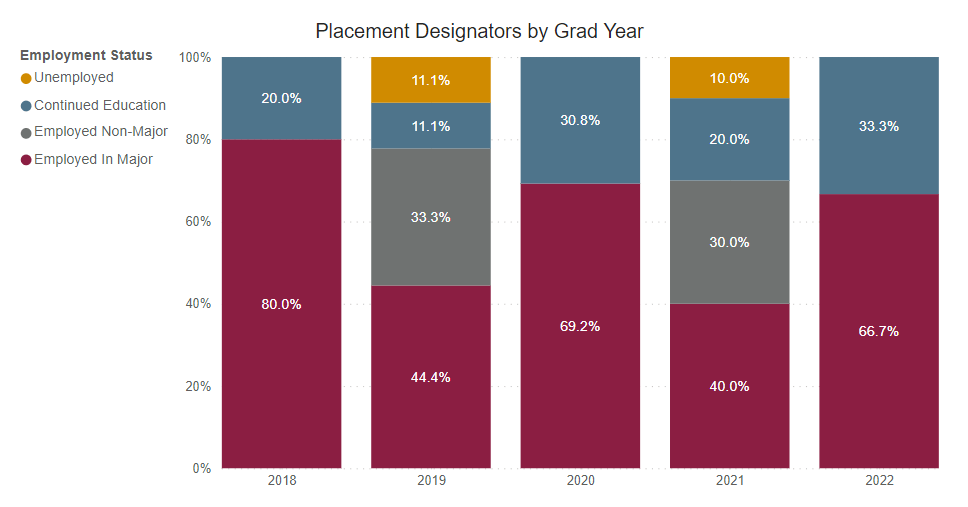
Employed Full Time Outside of Major
Percentage of graduates who reported being employed full-time outside their field of study.

Graduate Satisfaction
This is the median graduate survey response evaluating the level of preparation for workforce entry (based on a 5-Item Likert Scale).

Placement Rate
This is the percent of graduate survey respondents who reported being employed or continued their education on a full-time basis.

Employed Full Time Within Major
Percentage of graduates who reported being employed full-time within their field of study.

Annual Median Starting Salary
This number is based on the graduate survey response to the request to identify a starting salary from a range of options. This graph shows the median first-year annual salary. All calculations are based on the respondent’s self-reported first-year annual income.

Reported Hourly Rate
This number is determined by dividing the reported median salary by the number of hours in a traditional full-time work week (40), then the number of weeks in a year (52).

Our graduates work with the industry’s best


Here is a list of schools where our students have continued their education: