Collision Repair Technology
Get started today
About Collision Repair Technology
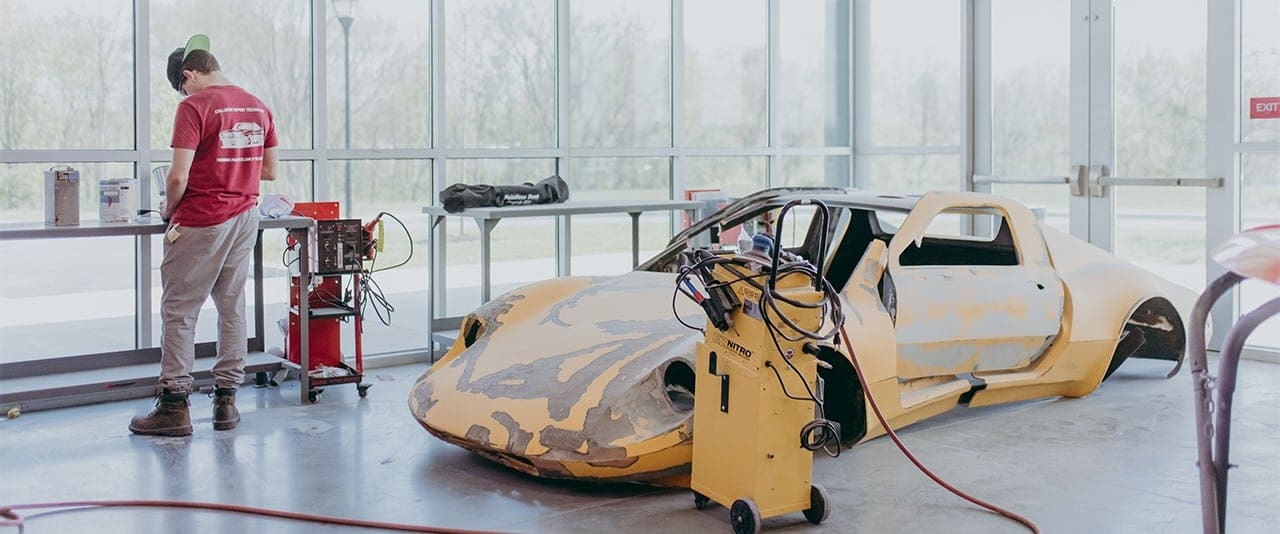
Students will be instructed in a series of I-CAR courses in Non-Structural ProLevel 1 and Refinishing ProLevel 1, the industry standard for collision repair training. Students graduate with a variety of nationally recognized Platinum certificates from I-CAR. This program aligns with collision repair businesses needing to hire employees to maintain or become I-CAR Gold Class Professionals. This program makes students proficient at entry-level tasks. Students also have the opportunity to become certified as ASE Master Technicians. The Collision Technology Repair program is dedicated to providing the most current and complete information, knowledge and skills required to perform complete, safe and quality repairs. Thaddeus Stevens College of Technology provides you with comprehensive training and industry-recognized credentials for a successful career in collision repair.
What you’ll learn
- Use collision repair tools and equipment safely and effectively.
- Analyze the structural design of a vehicle and its reaction to an impact.
- Repair damaged metal.
- Refinish vehicles.
- Install panels.
- Repair frame damage.
Sample Job Titles
Auto Body Man, Auto Body Repair Technician (Auto Body Repair Tech), Auto Body Repairman, Automotive Body Technician (Auto Body Tech), Body Man, Body Technician (Body Tech), Collision Repair Technician (Collision Repair Tech), Collision Technician (Collision Tech), Frame Man, Refinish Technician (Refinish Tech)
Soar Agreement
This program enables students to apply certain credits earned in high school to the credits needed for a degree or certificate through Thaddeus Stevens College. The Collision Repair Technology degree qualifies for this program – see our SOAR program page for details!
Quick facts
Location
Thaddeus Sevens College Transportation Center
Type of program
Associate Degree
Job/Salary Outlook
See industry data
Length of program
2 years, 73 credits
Cost of program
$4,500/semester tuition
$3,000 – $3,500/semester housing
$1,850 – $2,335/semester meal plan
Tool List (PDF)

The outcomes speak for themselves
Graduates of this program work in the Architectural, Engineering, and Construction (AEC) industry and can also transfer into programs in nationally accredited universities.
100%
employment
$45K
med. salary

Program details
Courses
MODEL SCHEDULE FOR COLLISION REPAIR TECHNOLOGY
Semester 1
- CORT 107 Details of Body Construction (4 credits)
- CORT 111 Collision Repair Welding (4 credits)
- CORT 116 Repairing Damaged Panels & Metalworking (4 credits)
- MATH 126 Technical Math I or Higher (3 credits)
- BUSN 106 Small Business Management (3 credits)
Semester 2
- CORT 156 Introduction to Refinishing Procedures (4 credits)
- CORT 162 Panel Replacement, Adjustment, Corr. Protection (4 credits)
- CORT 166 Introduction to Frame Alignment and Repair (4 credits)
- ENG 106 English Composition (3 credits)
- CIS 111 Intro to Computer Applications (3 credits)
Semester 3
- CORT 212 Estimating Technology (4 credits)
- CORT 222 Aluminum Technology (4 credits)
- CORT 232 Non-Structural Technology (4 credits)
- MATH 111 Business Math (3 credits)
- ENG 216 Technical Writing (3 credits)
Semester 4
- CORT 252 Steel Structural Technology (4 credits)
- CORT 262 Refinishing Technology (4 credits)
- CORT 272 Mechanical Technology (4 credits)
- Science Elective (3 credits)
- Humanities Elective (3 credits)
Additional General Education Requirements
- HEAL Elective: HEAL 106 or HEAL 111 (1 credit)
Total Credits 73
Faculty
Occupational Advisory Committee
The Occupational Advisory Committee (OAC) serves as a vital link between the Program of study and industry, ensuring that the program remains aligned with current workforce needs, technological advancements, and best practices in the field. Composed of employers, educators, and other community members, the committee provides guidance, feedback, and recommendations to enhance the curriculum, instructional methods, and student learning experiences.
Purpose and Responsibilities:
- Curriculum & Industry Alignment
- Workforce Readiness
- Student & Faculty Support
- Internship & Employment Connections
- Accreditation & Program Evaluation
- Facilities & Equipment Recommendations
By fostering a strong relationship between academia and industry, the OAC helps ensure that Thaddeus Stevens College programs maintain the highest standards in CTE (career and technical education).
- Gene Barton, Jr., Barton’s Body Shop
- April Lausch, Faulkner Collision Center of Lancaster
- Michael Wright, Cox Automotive
Essential Skills Learned
Tasks
- File, grind, sand, and smooth-filled or repaired surfaces, using power tools and hand tools.
- Inspect repaired vehicles for proper functioning, completion of work, dimensional accuracy, and overall appearance of the paint job, and test-drive vehicles to ensure proper alignment and handling.
- Fit and weld replacement parts into place, using wrenches and welding equipment, and grind down welds to smooth them, using power grinders and other tools.
- Prime and paint repaired surfaces, using paint spray guns and motorized sanders.
- Follow supervisors’ instructions as to which parts to restore or replace and how much time the job should take.
- Sand body areas to be painted and cover bumpers, windows, and trim with masking tape or paper to protect them from the paint.
- Chain or clamp frames and sections to alignment machines that use hydraulic pressure to align damaged components.
- Position dolly blocks against surfaces of dented areas and beat opposite surfaces to remove dents, using hammers.
- Cut and tape plastic separating film to outside repair areas to avoid damaging surrounding surfaces during repair procedure and remove tape and wash surfaces after repairs are complete.
- Review damage reports, prepare or review repair cost estimates, and plan work to be performed.
Tools used in this occupation
- Adjustable widemouth pliers
- Adjustable wrenches
- Air compressors
- Anvils
- Blow torch — Blow torches; Oxyacetylene torches
- Calipers — Vernier calipers
- Chisel bit — Spot weld breakers
- Cold chisels
Technology used in this occupation
- Accounting software — Accounts receivable software
- Analytical or scientific software — Collision damage estimation software; Collision damage measurement software; Paint mixing and matching software; Swan River Estimiser Pro
- Calendar and scheduling software — Appointment scheduling software
- Database user interface and query software — AutoZone ALLDATA; Equipment management information software
- Inventory management software — Materials management software
Knowledge
- Mechanical — Knowledge of machines and tools, including their designs, uses, repair, and maintenance.
- Customer and Personal Service — Knowledge of principles and processes for providing customer and personal services. This includes customer needs assessment, meeting quality standards for services, and evaluation of customer satisfaction.
- Production and Processing — Knowledge of raw materials, production processes, quality control, costs, and other techniques for maximizing the effective manufacture and distribution of goods.
- Mathematics — Knowledge of arithmetic, algebra, geometry, calculus, statistics, and their applications.
Skills
- Repairing — Repairing machines or systems using the needed tools.
- Troubleshooting — Determining causes of operating errors and deciding what to do about it.
- Active Listening — Giving full attention to what other people are saying, taking time to understand the points being made, asking questions as appropriate, and not interrupting at inappropriate times.
- Critical Thinking — Using logic and reasoning to identify the strengths and weaknesses of alternative solutions, conclusions or approaches to problems.
- Monitoring — Monitoring/Assessing performance of yourself, other individuals, or organizations to make improvements or take corrective action.
- Operation Monitoring — Watching gauges, dials, or other indicators to make sure a machine is working properly.
- Quality Control Analysis — Conducting tests and inspections of products, services, or processes to evaluate quality or performance.
- Speaking — Talking to others to convey information effectively.
Abilities
- Arm-Hand Steadiness — The ability to keep your hand and arm steady while moving your arm or while holding your arm and hand in one position.
- Manual Dexterity — The ability to quickly move your hand, your hand together with your arm, or your two hands to grasp, manipulate, or assemble objects.
- Visualization — The ability to imagine how something will look after it is moved around or when its parts are moved or rearranged.
- Finger Dexterity — The ability to make precisely coordinated movements of the fingers of one or both hands to grasp, manipulate, or assemble very small objects.
- Information Ordering — The ability to arrange things or actions in a certain order or pattern according to a specific rule or set of rules (e.g., patterns of numbers, letters, words, pictures, mathematical operations).
- Near Vision — The ability to see details at close range (within a few feet of the observer).
- Oral Comprehension — The ability to listen to and understand information and ideas presented through spoken words and sentences.
- Problem Sensitivity — The ability to tell when something is wrong or is likely to go wrong. It does not involve solving the problem, only recognizing there is a problem.
- Visual Color Discrimination — The ability to match or detect differences between colors, including shades of color and brightness
Work Activities
- Updating and Using Relevant Knowledge — Keeping up-to-date technically and applying new knowledge to your job.
- Getting Information — Observing, receiving, and otherwise obtaining information from all relevant sources.
- Making Decisions and Solving Problems — Analyzing information and evaluating results to choose the best solution and solve problems.
- Operating Vehicles, Mechanized Devices, or Equipment — Running, maneuvering, navigating, or driving vehicles or mechanized equipment, such as forklifts, passenger vehicles, aircraft, or watercraft.
- Identifying Objects, Actions, and Events — Identifying information by categorizing, estimating, recognizing differences or similarities, and detecting changes in circumstances or events.
- Inspecting Equipment, Structures, or Material — Inspecting equipment, structures, or materials to identify the cause of errors or other problems or defects.
- Organizing, Planning, and Prioritizing Work — Developing specific goals and plans to prioritize, organize, and accomplish your work.
- Communicating with Supervisors, Peers, or Subordinates — Providing information to supervisors, co-workers, and subordinates by telephone, in written form, e-mail, or in person.
- Evaluating Information to Determine Compliance with Standards — Using relevant information and individual judgment to determine whether events or processes comply with laws, regulations, or standards.
Work Context
- Exposed to Contaminants — 100% responded “Every day.”
- Spend Time Using Your Hands to Handle, Control, or Feel Objects, Tools, or Controls — 95% responded “Continually or almost continually.”
- Wear Common Protective or Safety Equipment such as Safety Shoes, Glasses, Gloves, Hearing Protection, Hard Hats, or Life Jackets — 88% responded “Every day.”
- Time Pressure — 53% responded “Every day.”
- Exposed to Hazardous Conditions — 81% responded “Every day.”
- Sounds, Noise Levels Are Distracting or Uncomfortable — 84% responded “Every day.”
- Face-to-Face Discussions — 65% responded “Every day.”
- Importance of Being Exact or Accurate — 52% responded “Extremely important.”
- Duration of Typical Work Week — 66% responded “More than 40 hours.”
- Spend Time Bending or Twisting the Body — 52% responded “Continually or almost continually.”
Interests
- Realistic – Realistic occupations frequently involve work activities that include practical, hands-on problems, and solutions. They often deal with plants, animals, and real-world materials like wood, tools, and machinery. Many of the occupations require working outside and do not involve a lot of paperwork or working closely with others.
Work Styles
- Attention to Detail — Job requires being careful about detail and thorough in completing work tasks.
- Dependability — Job requires being reliable, responsible, and dependable, and fulfilling obligations.
- Integrity — Job requires being honest and ethical.
- Achievement/Effort — Job requires establishing and maintaining personally challenging achievement goals and exerting effort toward mastering tasks.
- Innovation — Job requires creativity and alternative thinking to develop new ideas for and answers to work-related problems.
- Analytical Thinking — Job requires analyzing information and using logic to address work-related issues and problems.
- Initiative — Job requires a willingness to take on responsibilities and challenges.
- Persistence — Job requires persistence in the face of obstacles.
- Independence — Job requires developing one’s own ways of doing things, guiding oneself with little or no supervision, and depending on oneself to get things done.
Work Values
- Support — Occupations that satisfy this work value offer supportive management that stands behind employees. Corresponding needs are Company Policies, Supervision: Human Relations and Supervision: Technical.
- Relationships — Occupations that satisfy this work value allow employees to provide service to others and work with co-workers in a friendly non-competitive environment. Corresponding needs are Co-workers, Moral Values, and Social Service.
- Independence — Occupations that satisfy this work value allow employees to work on their own and make decisions. Corresponding needs are Creativity, Responsibility, and Autonomy.
Performance Measures
Internal Key Performance Indicators (Sources: Internal data collections, and Post-Graduate Surveys)
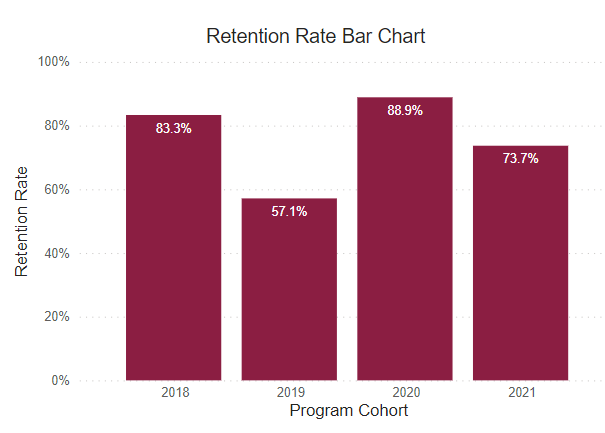
Retention Rate
This rate reflects the continuous term-to-term persistence rate for certificate programs and the fall-to-fall retention rate for associate degree programs.
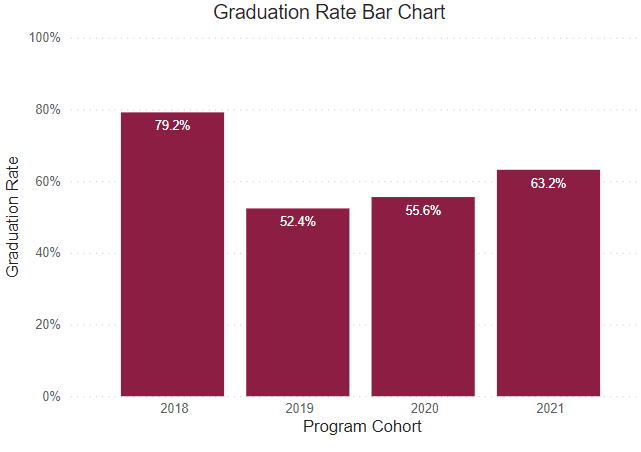
Graduation Rate
This rate reflects the number of freshmen who were officially enrolled in the fall semester and earned a certificate or degree within the expected timeframe.
Post Graduate Survey Response Rate
The post graduate survey is an annual on-line post graduate survey utilized by the college to gather vital information regarding career placement, starting salary, and level of satisfaction.

Employed Full Time Outside of Major
Percentage of graduates who reported being employed full-time outside their field of study.
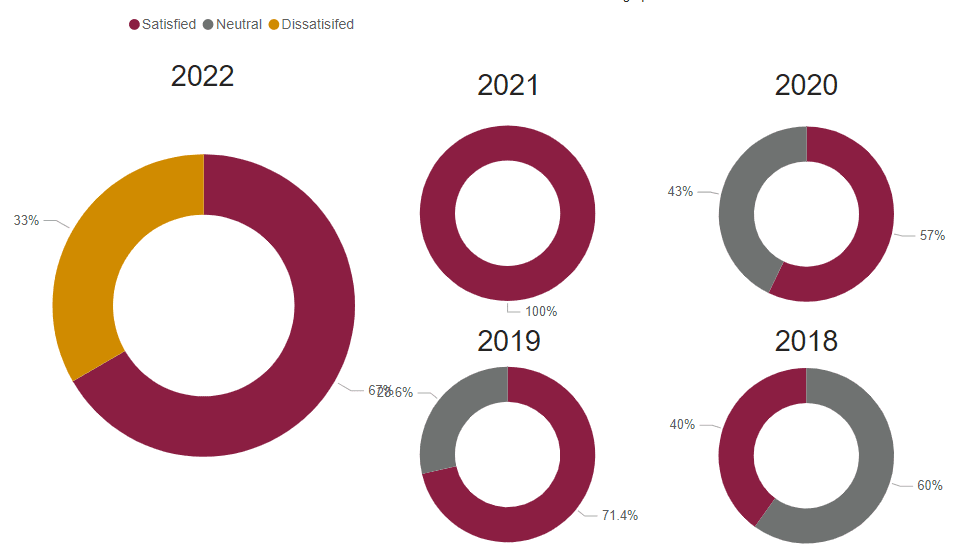
Graduate Satisfaction
This is the median graduate survey response evaluating the level of preparation for workforce entry (based on a 5-Item Likert Scale).
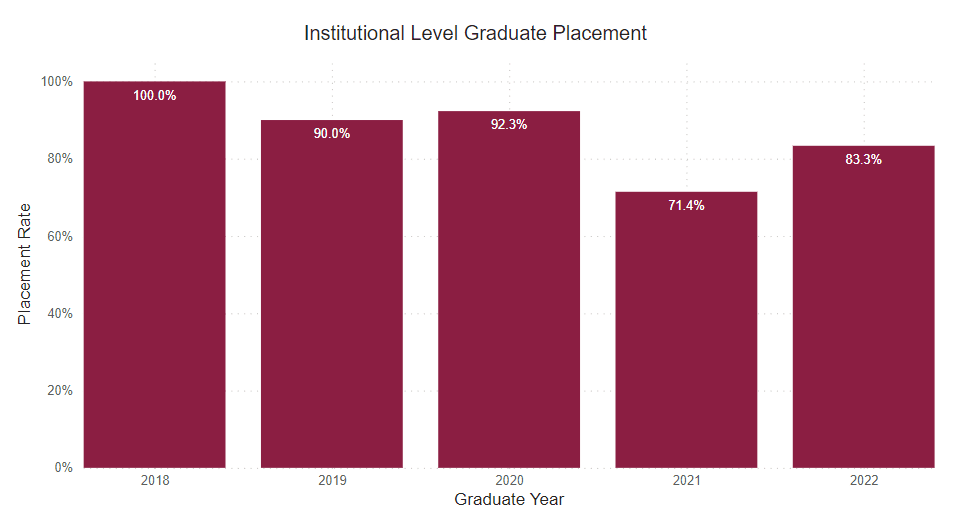
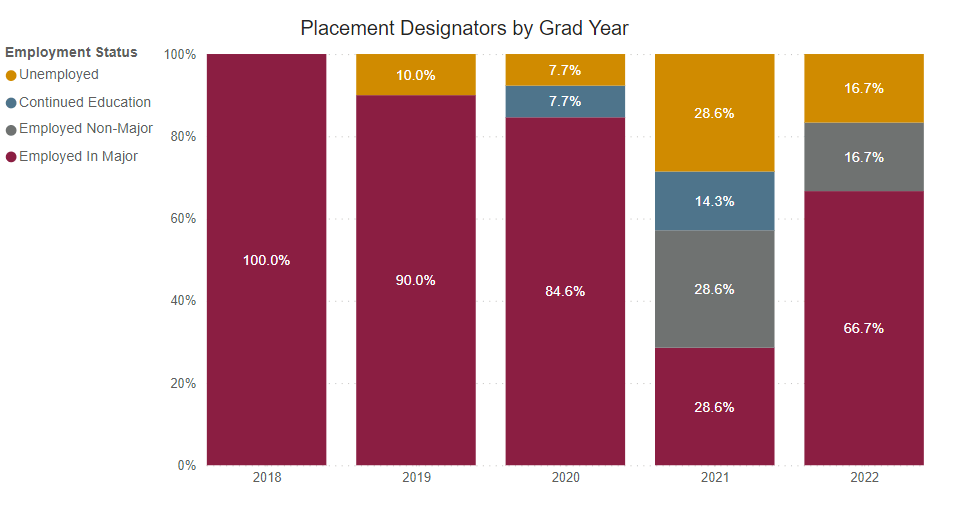
Placement Rate
This is the percent of graduate survey respondents who reported being employed or continued their education on a full-time basis.

Employed Full Time Within Major
Percentage of graduates who reported being employed full-time within their field of study.
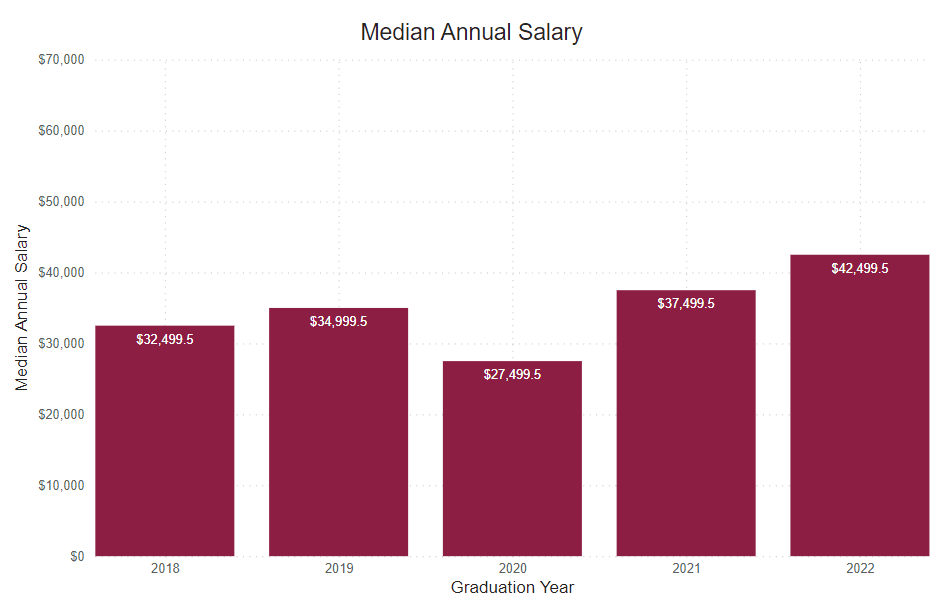
Annual Median Starting Salary
This number is based on the graduate survey response to the request to identify a starting salary from a range of options. This graph shows the median first-year annual salary. All calculations are based on the respondent’s self-reported first-year annual income.
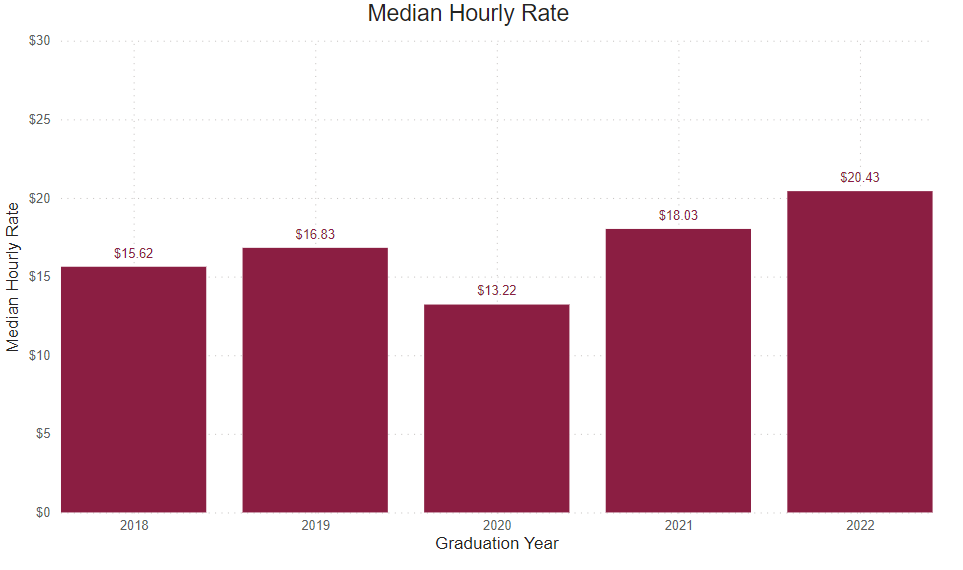
Reported Hourly Rate
This number is determined by dividing the reported median salary by the number of hours in a traditional full-time work week (40), then the number of weeks in a year (52).

Our graduates work with the industry’s best
