
Engineering CAD Technology
Get started today
About Engineering CAD Technology
The Engineering Computer-Aided Drafting (ECAD) Technology program prepares graduates for positions as entry-level CAD operators in a wide range of manufacturing and engineering industries. Skills acquired from this program of study will allow students to become an integral part of product design and the manufacturing of those products. Graduates will apply specialized knowledge and skills utilizing state-of-the-art CAD software to think critically, to solve problems, and effectively communicate with colleagues and supervisors in today’s ever-changing work environment.
From preliminary drawings and sketches to parametric design, to animated assemblies, graduates will learn how to simplify, enhance, and streamline the manufacturing and engineering processes utilizing CAD. Students acquire comprehensive skills in the following technical areas: fundamentals of drafting, technical drawing, process pipe drafting, processes of manufacturing, geometric dimensioning and tolerancing (GD&T), metals fabrication drafting, and power transmission. Students’ CAD skills are developed with a comprehensive exposure to the latest software releases of AutoCAD®, Autodesk Inventor®, SolidWorks®, and Pro/Engineer®.
Upon completion of the program, graduates will find various employment opportunities in the following fields:
- CAD Operator
- Cost Estimator
- Drafting Manager
- Drafting Supervisor
- Mechanical Detailer
What you’ll learn
- Produce working drawings such as detail, subassembly, and full-assembly drawings utilizing manual, freehand, and computer-aided drafting techniques.
- Recognize and apply the ASME Y14.5 guidelines in the creation of mechanical working drawings.
- Apply industrial standards to the creation of working drawings of sheet-metal components, welded assemblies, electronics drafting, piping systems, and power transmission components.
- Identify and understand basic manufacturing processes as they relate to the dimensioning of working drawings.
- Demonstrate an ability to work independently and to apply interpersonal and technical skills to solve problems as a member of a multi-disciplinary team.
- Demonstrate skills and proficiency in multiple 2D and 3D solid modeling CAD software packages.
Sample Job Titles
Mechanical Drafter, Designer, Drafter, Design Drafter, Mechanical Designer, CAD Designer (Computer-Aided Design Designer), CAD Operator (Computer-Aided Design Operator), CAD/CAM Specialist (Computer-Aided Design/Computer-Aided Manufacturing Specialist), Project Designer, Installation Drafter
Soar Agreements
This program enables students to apply certain credits earned in high school to the credits needed for a degree or certificate through Thaddeus Stevens College. The Engineering CAD Technology degree qualifies for this program – see our SOAR program page for details!
Quick facts
Location
First floor, Griscom Education Center
Type of program
Associate Degree
Job/Salary Outlook
See industry data
Length of program
2 years, 73 credits
Cost of program
$4,500/semester tuition
$3,000 – $3,500/semester housing
$1,850 – $2,335/semester meal plan
Tool List (PDF)

The outcomes speak for themselves
Students who complete this program will be able to prepare detailed working diagrams of machinery and mechanical devices, including dimensions, fastening methods, and other engineering information.
88.3%
employment
$57.5K
med. salary
People of TSCT
Success stories

Program details
Courses
MODEL SCHEDULE FOR ENGINEERING COMPUTER AIDED DRAFTING TECHNOLOGY
Semester 1
- ECAD 105 Metallic Manufacturing Processes (3 credits)
- ECAD 112 Technical Drawing (3 credits)
- ECAD 120 Intro to AutoCAD Applications (3 credits)
- ECAD 130 Advanced AutoCAD Applications (3 credits)
- MATH 137 Intermediate Algebra (or higher math) (3 credits)
- CIS 211 Microsoft Excel (3 credits)
Semester 2
- ECAD 150 Intro to AutoDesk Inventor Applicatins (3 credits)
- ECADT 160 Advanced AutoDesk Inventor Applications (3 credits)
- ECAD 168 Proces Pipe Drafting (3 credits)
- ECAD 171 Non-Metallic Manufacturing Processes (3 credits)
- MATH 141 Trigonometry (or higher math) (3 credits)
- ENG 106 English Composition (3 credits)
Semester 3
- ECAD 207 Geometric Tolerancing (3 credits)
- ECAD 211 Metals Fabrication Drafting (3 credits)
- ECAD 220 Intro to Solid Works Applications (3 credits)
- ECAD 230 Advanced Solid Works Applications (3 credits)
- ENG 216 Technical Report Writing (3 credits)
- Physics Elective (3 credits)
Semester 4
- ECAD 250 Intro to Pro/Engineer Applications (3 credits)
- ECAD 260 Advanced Pro/Engineer Applications (3 credits)
- ECAD 266 Working Drawings (3 credits)
- ECAD 271 Power Transmission (3 credits)
- ENG 221 Public Speaking (3 credits)
- Humanities Elective (3 credits)
Additional General Education Requirements
- HEAL Elective HEAL 106 or HEAL 111 (1 credit)
Total Credits 73
Faculty
Occupational Advisory Committee
The Occupational Advisory Committee (OAC) serves as a vital link between the Program of study and industry, ensuring that the program remains aligned with current workforce needs, technological advancements, and best practices in the field. Composed of employers, educators, and other community members, the committee provides guidance, feedback, and recommendations to enhance the curriculum, instructional methods, and student learning experiences.
Purpose and Responsibilities:
- Curriculum & Industry Alignment
- Workforce Readiness
- Student & Faculty Support
- Internship & Employment Connections
- Accreditation & Program Evaluation
- Facilities & Equipment Recommendations
By fostering a strong relationship between academia and industry, the OAC helps ensure that Thaddeus Stevens College programs maintain the highest standards in CTE (career and technical education).
- Markus Couch, Tecta America East, LLC
- Scott Dolor, M. Davis & Sons
- Jesse Eckert, TE Connectivity
- Kelsey Haldeman, Astro Machine Works
- Justin Klinovski, Paragon Engineering Services, Inc.
- Brittani Morales, Actalent
- Laura Schoonover, Actalent
- Vanessa Shonk, High Steel Structures
Essential Skills Learned
Tasks
- Develop detailed design drawings and specifications for mechanical equipment, dies, tools, and controls, using computer-assisted drafting (CAD) equipment.
- Produce three-dimensional models, using computer-aided design (CAD) software.
- Layout and draw schematic, orthographic, or angle views to depict functional relationships of components, assemblies, systems, and machines.
- Modify and revise designs to correct operating deficiencies or to reduce production problems.
- Review and analyze specifications, sketches, drawings, ideas, and related data to assess factors affecting component designs and the procedures and instructions to be followed.
- Check the dimensions of materials to be used and assign numbers to the materials.
- Design scale or full-size blueprints of specialty items, such as furniture and automobile body or chassis components.
- Compute mathematical formulas to develop and design detailed specifications for components or machinery, using computer-assisted equipment.
Tools used in this occupation
- Curves — Flexible curves; French curves
- Graphics or video accelerator cards — Computer-aided design CAD multi-unit display graphics cards
- Plotter printers — Cutting plotters; Plotters
- Scales — Architects’ scales; Electronic scales
- Scanners — Backlit digitizers; Sonic digitizers; Three-dimensional laser digitizers; Wide-format document scanners
Technology used in this occupation
- Computer-aided design CAD software — Autodesk AutoCAD Civil 3D; Autodesk Revit; Bentley Microstation; Dassault Systemes SOLIDWORKS
- Document management software — Document management system software
- Enterprise resource planning ERP software — ERP software; SAP
- Graphics or photo imaging software — Adobe Systems Adobe After Effects; Adobe Systems Adobe LiveMotion; Non-uniform rational b-splines NURBS software; Trimble SketchUp Pro
- Presentation software — Microsoft PowerPoint
Knowledge
- Design — Knowledge of design techniques, tools, and principles involved in production of precision technical plans, blueprints, drawings, and models.
- Engineering and Technology — Knowledge of the practical application of engineering science and technology. This includes applying principles, techniques, procedures, and equipment to the design and production of various goods and services.
- Mechanical — Knowledge of machines and tools, including their designs, uses, repair, and maintenance.
- Mathematics — Knowledge of arithmetic, algebra, geometry, calculus, statistics, and their applications.
- English Language — Knowledge of the structure and content of the English language including the meaning and spelling of words, rules of composition, and grammar.
- Physics — Knowledge, and prediction of physical principles, laws, their interrelationships, and applications to understanding fluid, material, and atmospheric dynamics, and mechanical, electrical, atomic, and sub-atomic structures and processes.
- Computers and Electronics — Knowledge of circuit boards, processors, chips, electronic equipment, and computer hardware and software, including applications and programming.
Skills
- Active Learning — Understanding the implications of new information for both current and future problem-solving and decision-making.
- Active Listening — Giving full attention to what other people are saying, taking time to understand the points being made, asking questions as appropriate, and not interrupting at inappropriate times.
- Critical Thinking — Using logic and reasoning to identify the strengths and weaknesses of alternative solutions, conclusions or approaches to problems.
- Mathematics — Using mathematics to solve problems.
- Reading Comprehension — Understanding written sentences and paragraphs in work related documents.
- Complex Problem Solving — Identifying complex problems and reviewing related information to develop and evaluate options and implement solutions.
- Speaking — Talking to others to convey information effectively.
- Coordination — Adjusting actions in relation to others’ actions.
- Instructing — Teaching others how to do something.
Abilities
- Near Vision — The ability to see details at close range (within a few feet of the observer).
- Mathematical Reasoning — The ability to choose the right mathematical methods or formulas to solve a problem.
- Visualization — The ability to imagine how something will look after it is moved around or when its parts are moved or rearranged.
- Fluency of Ideas — The ability to come up with a number of ideas about a topic (the number of ideas is important, not their quality, correctness, or creativity).
- Oral Comprehension — The ability to listen to and understand information and ideas presented through spoken words and sentences.
- Oral Expression — The ability to communicate information and ideas in speaking so others will understand.
- Originality — The ability to come up with unusual or clever ideas about a given topic or situation, or to develop creative ways to solve a problem.
- Selective Attention — The ability to concentrate on a task over a period of time without being distracted.
- Speech Clarity — The ability to speak clearly so others can understand you.
- Speech Recognition — The ability to identify and understand the speech of another person.
Work Activities
- Drafting, Laying Out, and Specifying Technical Devices, Parts, and Equipment — Providing documentation, detailed instructions, drawings, or specifications to tell others about how devices, parts, equipment, or structures are to be fabricated, constructed, assembled, modified, maintained, or used.
- Interacting With Computers — Using computers and computer systems (including hardware and software) to program, write software, set up functions, enter data, or process information.
- Getting Information — Observing, receiving, and otherwise obtaining information from all relevant sources.
- Thinking Creatively — Developing, designing, or creating new applications, ideas, relationships, systems, or products, including artistic contributions.
- Communicating with Supervisors, Peers, or Subordinates — Providing information to supervisors, co-workers, and subordinates by telephone, in written form, e-mail, or in person.
- Making Decisions and Solving Problems — Analyzing information and evaluating results to choose the best solution and solve problems.
- Monitor Processes, Materials, or Surroundings — Monitoring and reviewing information from materials, events, or the environment, to detect or assess problems.
- Updating and Using Relevant Knowledge — Keeping up-to-date technically and applying new knowledge to your job.
- Documenting/Recording Information — Entering, transcribing, recording, storing, or maintaining information in written or electronic/magnetic form.
Work Context
- Indoors, Environmentally Controlled — 100% responded “Every day.”
- Electronic Mail — 98% responded “Every day.”
- Importance of Being Exact or Accurate — 70% responded “Extremely important.”
- Face-to-Face Discussions — 72% responded “Every day.”
- Freedom to Make Decisions — 51% responded “A lot of freedom.”
- Spend Time Sitting — 51% responded “Continually or almost continually.”
- Structured versus Unstructured Work — 56% responded “Some freedom.”
- Duration of Typical Work Week — 56% responded “More than 40 hours.”
- Telephone — 56% responded “Once a week or more but not every day.”
Interests
- Realistic – Realistic occupations frequently involve work activities that include practical, hands-on problems, and solutions. They often deal with plants, animals, and real-world materials like wood, tools, and machinery. Many of the occupations require working outside and do not involve a lot of paperwork or working closely with others.
- Conventional – Conventional occupations frequently involve following set procedures and routines. These occupations can include working with data and details more than with ideas. Usually, there is a clear line of authority to follow.
- Investigative – Investigative occupations frequently involve working with ideas and require an extensive amount of thinking. These occupations can involve searching for facts and figuring out problems mentally.
Work Styles
- Attention to Detail — Job requires being careful about detail and thorough in completing work tasks.
- Analytical Thinking — Job requires analyzing information and using logic to address work-related issues and problems.
- Dependability — Job requires being reliable, responsible, and dependable, and fulfilling obligations.
- Integrity — Job requires being honest and ethical.
- Initiative — Job requires a willingness to take on responsibilities and challenges.
- Cooperation — Job requires being pleasant with others on the job and displaying a good-natured, cooperative attitude.
- Innovation — Job requires creativity and alternative thinking to develop new ideas for and answers to work-related problems.
- Stress Tolerance — Job requires accepting criticism and dealing calmly and effectively with high-stress situations.
- Self-Control — Job requires maintaining composure, keeping emotions in check, controlling anger, and avoiding aggressive behavior, even in very difficult situations.
Work Values
- Support — Occupations that satisfy this work value offer supportive management that stands behind employees. Corresponding needs are Company Policies, Supervision: Human Relations and Supervision: Technical.
- Working Conditions — Occupations that satisfy this work value offer job security and good working conditions. Corresponding needs are Activity, Compensation, Independence, Security, Variety, and Working Conditions.
- Achievement — Occupations that satisfy this work value are results-oriented and allow employees to use their strongest abilities, giving them a feeling of accomplishment. Corresponding needs are Ability Utilization and Achievement.
Performance Measures
Internal Key Performance Indicators (Sources: Internal data collections, and Post-Graduate Surveys)
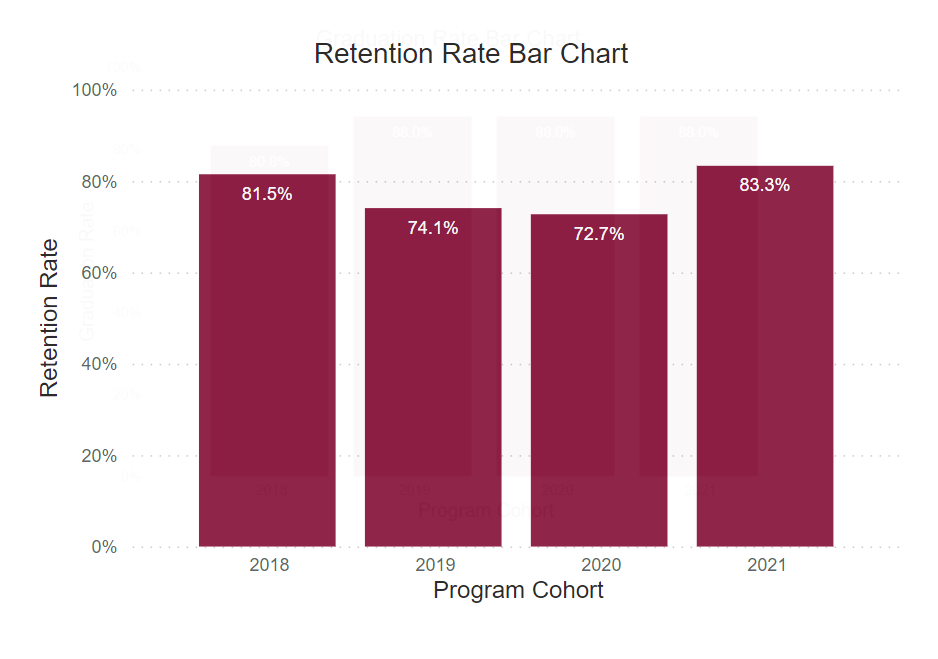
Retention Rate
This rate reflects the continuous term-to-term persistence rate for certificate programs and the fall-to-fall retention rate for associate degree programs.
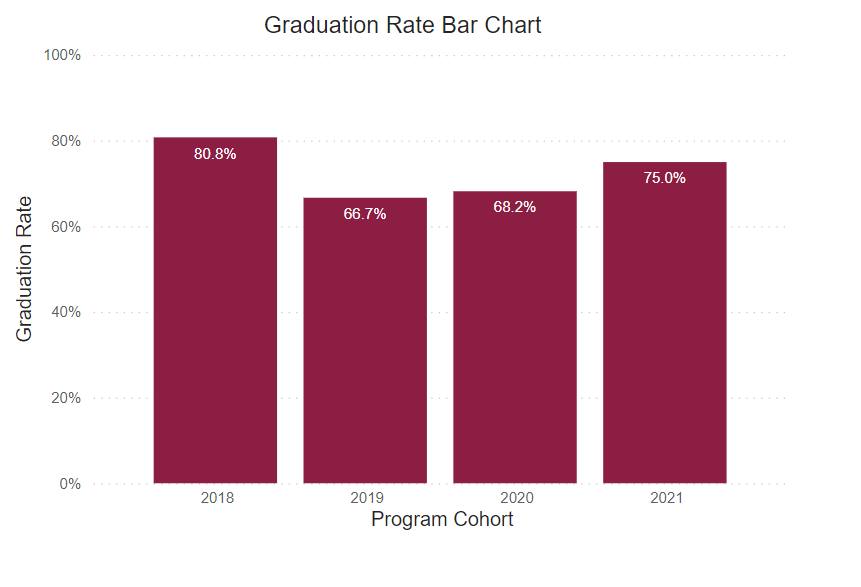
Graduation Rate
This rate reflects the number of freshmen who were officially enrolled in the fall semester and earned a certificate or degree within the expected timeframe.
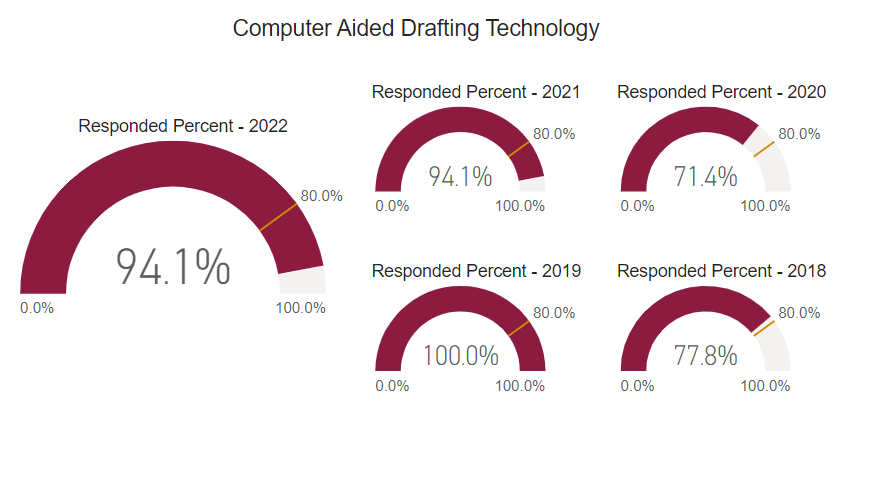
Post Graduate Survey Response Rate
The post graduate survey is an annual on-line post graduate survey utilized by the college to gather vital information regarding career placement, starting salary, and level of satisfaction.
Employed Full Time Outside of Major
Percentage of graduates who reported being employed full-time outside their field of study.
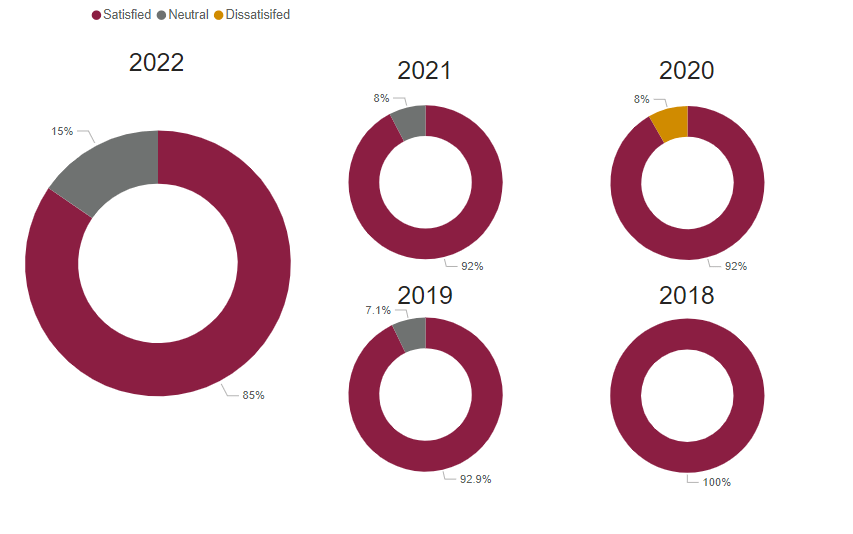
Graduate Satisfaction
This is the median graduate survey response evaluating the level of preparation for workforce entry (based on a 5-Item Likert Scale).
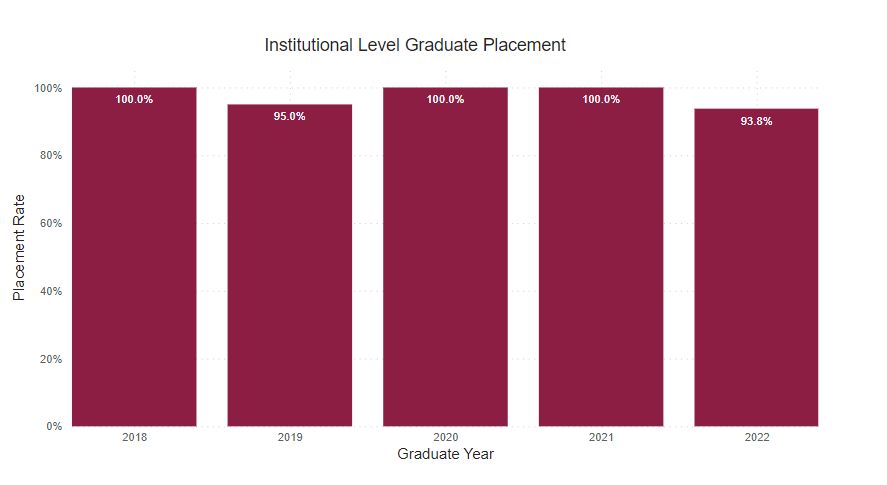
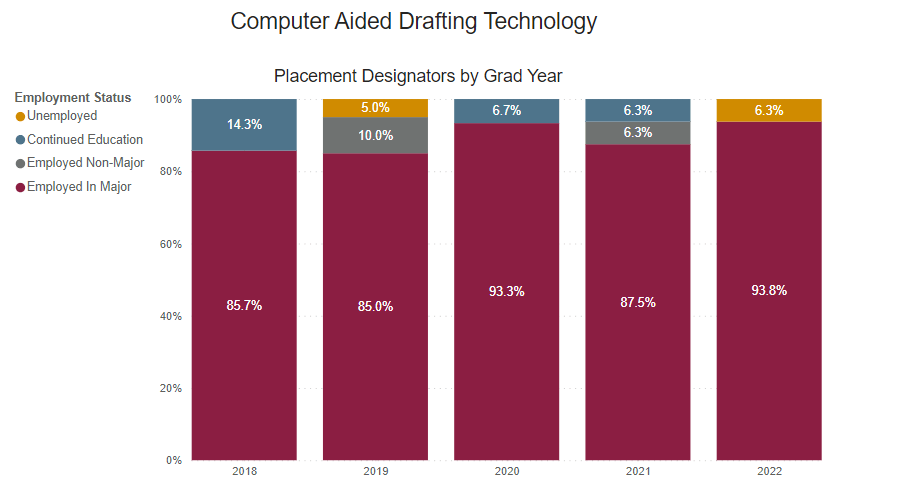
Placement Rate
This is the percent of graduate survey respondents who reported being employed or continued their education on a full-time basis.
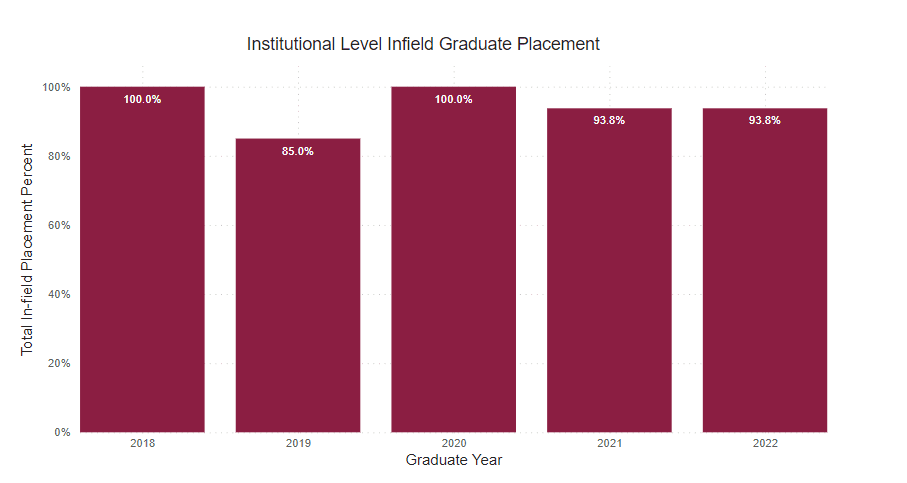
Employed Full Time Within Major
Percentage of graduates who reported being employed full-time within their field of study.
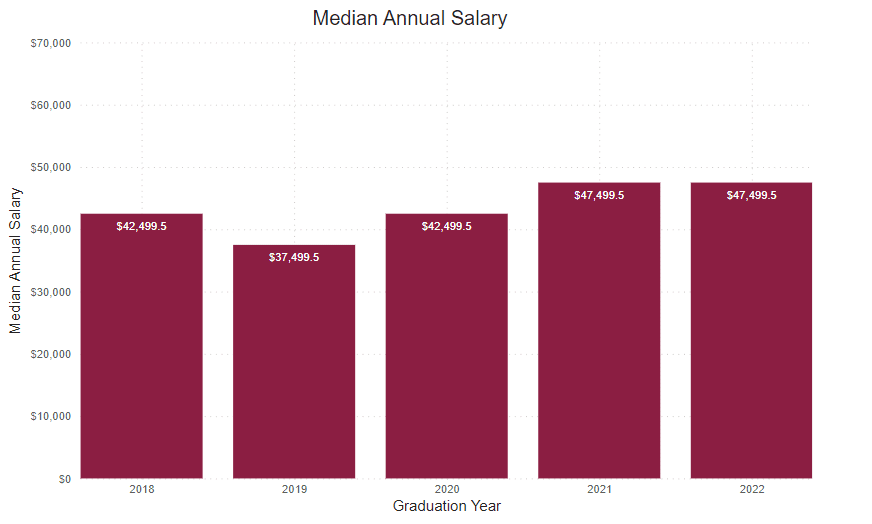
Annual Median Starting Salary
This number is based on the graduate survey response to the request to identify a starting salary from a range of options. This graph shows the median first-year annual salary. All calculations are based on the respondent’s self-reported first-year annual income.
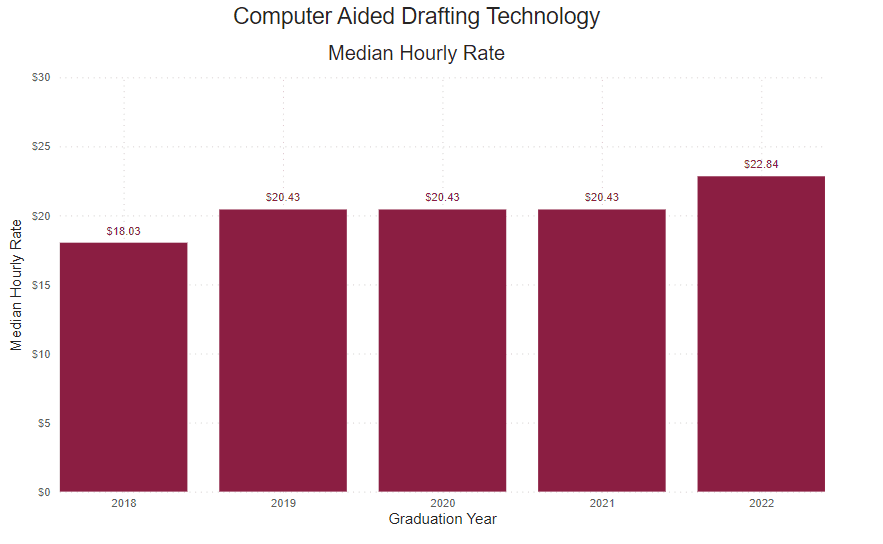
Reported Hourly Rate
This number is determined by dividing the reported median salary by the number of hours in a traditional full-time work week (40), then the number of weeks in a year (52).

Our graduates work with the industry’s best
