
Heating, Ventilation, & Air Conditioning, Refrigeration
Get started today
About HVAC/R
The HVAC/R program is unique because it treats designing, retrofitting, testing, and balancing on a problem-solving level. This specialized program prepares the technician for the fast-growing, highly technical HVAC/R field.
The challenge for the service technician is to optimize the service operation of HVAC/R systems to maximize customer and employer satisfaction. Using computers to replicate various conditions that could be encountered, students, develop a plan of action to use with live work.
Students learn current methods of identifying and performing efficiency evaluations on various types of heating, ventilation, and air-conditioning systems as well as adjusting and balancing equipment for maximum performance.
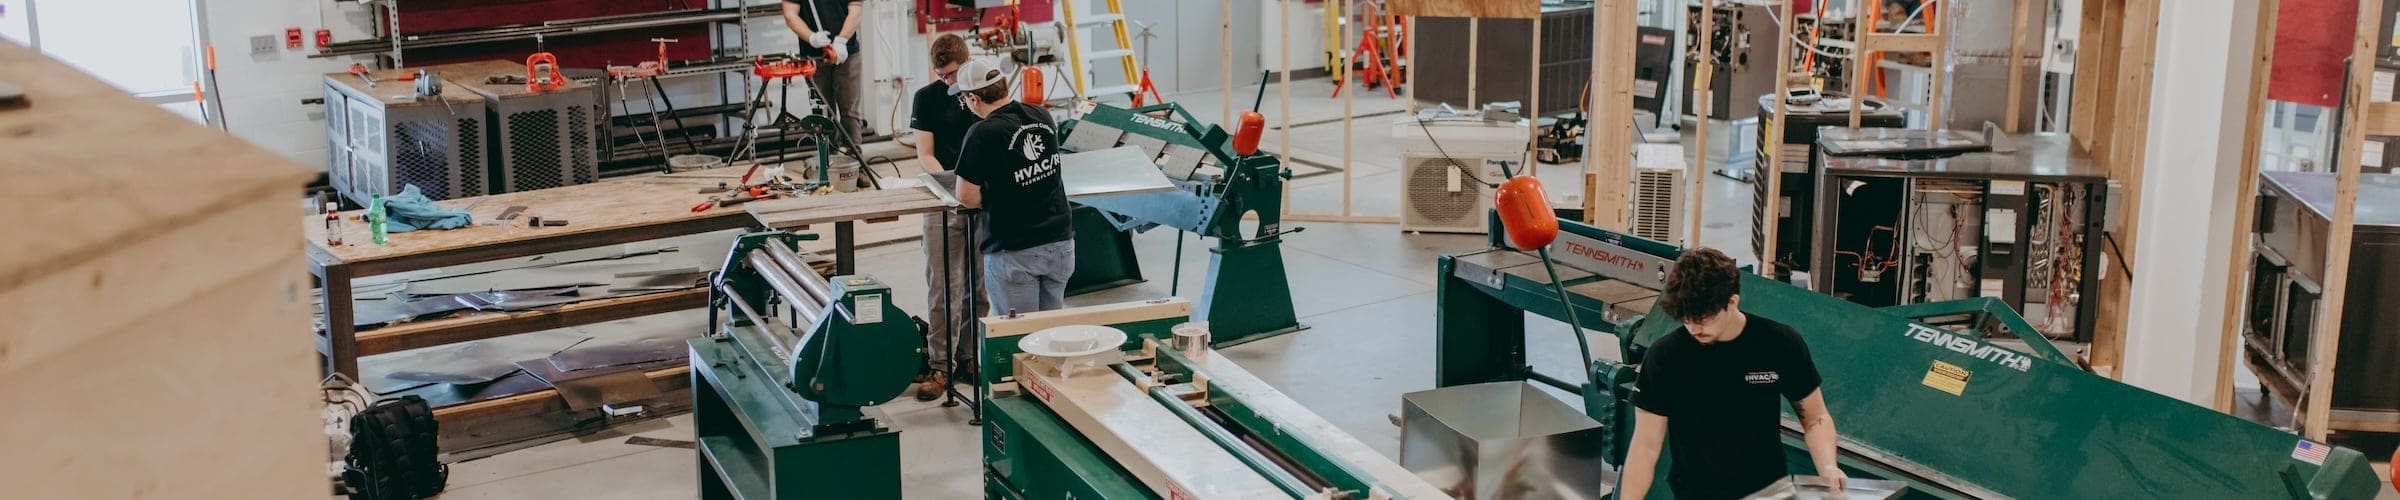
In addition to HVAC/R classroom theory sessions, students also perform service and installation on numerous live projects on and off-campus. The HVAC/R laboratory includes tools, equipment, computers, and instrumentation typically found in commercial, residential, and industrial settings. The lab also includes ground source heat pumps, gas efficient furnaces, regular heat pumps, oil-fired furnaces, gas and oil boilers, ice machines, walk-in boxes, roof-top equipment, chiller systems, and commercial refrigeration trainers.
Challenging careers abound on a national level with firms offering graduates a variety of positions as service technicians, installation technicians, estimators, and in-plant industrial technicians.
What you’ll learn
- Demonstrate the ability to do technical work in a variety of heating, cooling, and plumbing, and refrigeration fields; apply safety standards and understand and work with technical developments in the industry.
- Apply concepts of algebra and physics in the layout, design, development, and analysis of refrigeration and air conditioning equipment and systems.
- Identify and demonstrate the correct use of tools, materials, and equipment used in the trade.
- Demonstrate the ability to read and interpret blueprints and use blueprints when installing equipment.
- Troubleshoot heating, cooling, and refrigeration equipment using standard troubleshooting procedures.
- Write clear, concise, legible, and accurate technical reports using technical English and apply verbal communication skills in job-related activities.
- Read and interpret electrical schematics and use schematics when installing and repairing equipment.
- Estimate the cost of installation and design and layout an effective system for a specific location and use.
- Demonstrate knowledge of the operation and use of hermetic, reciprocating, and centrifugal compressors.
- Apply basic knowledge of airflow, ventilation, and energy conservation concepts to the design of systems, using modern building design and solar energy technology.
Sample Job Titles
Install, service, or repair heating and air conditioning systems in residences or commercial establishments.
- Heating, Ventilation, Air Conditioning Service Technician (HVAC Service Technician), Heating, Ventilation
- Air Conditioning Technician (AC Technician)
- Heating, Ventilation, Air Conditioning Installer (HVAC Installer)
- HVAC Specialist (Heating, Ventilation, and Air Conditioning Specialist)
- HVAC Technician (Heating, Ventilation, and Air Conditioning Technician)
- Heating, Ventilation, Air Conditioning Mechanic (HVAC Mechanic)
- Mechanic
Soar Agreements
This program enables students to apply certain credits earned in high school to the credits needed for a degree or certificate through Thaddeus Stevens College. The HVAC-R Technology degree qualifies for this program – see our SOAR program page for details!
Quick facts
Location
South Building, Greiner Advanced Manufacturing Center
Type of program
Associate Degree
Job/Salary Outlook
See industry data
Length of program
2 years, 74 credits
Cost of program
$4,500/semester tuition
$3,000 – $3,500/semester housing
$1,850 – $2,335/semester meal plan
Tool List (PDF)

The outcomes speak for themselves
Graduates of the HVACR program optimize the service operation of HVAC/R systems to maximize customer and employer satisfaction.
100%
employment
$57.5K
med. salary
People of TSCT
Success stories

Program details
Courses
MODEL SCHEDULE FOR HVAC-R
Semester 1
- HVAC 123 OSHA Electrical & Construction Safety (1 credit)
- HVAC 135 Electricity for HVACR (3 credits)
- HVAC 138 Lab Practice I: Electrical Applications (2 credits)
- HVAC 143 HVAC Installation Procedures (1 credit)
- HVAC 146 Lab Practice II: Installation Procedures (2 credits)
- HVAC 150 Principles of Refrigeration (3 credits)
- Math Elective Math 137 (or higher) (3 credits)
- Science Elective (3 credits)
Semester 2
- HVAC 155 Residential Heating Systems (3 credits)
- HVAC 160 Lab Practice III: Heating Applications (2 credits)
- HVAC 167 Refrigerant System Components (2 credits)
- HVAC 170 Lab Practice IV: Cooling Applications (2 credits)
- HVAC 175 Refrigerant Management (2 credits)
- HVAC 180 Mechanical Codes for HVACR (1 credit)
- Math Elective Math 132 Elementary Geometry (or higher) (3 credits)
- ENG 106: English Composition (3 credits)
Semester 3
- HVAC 206 Air Conditioning Systems (4 credits)
- HVAC 211 Heat Pump Systems (3 credits)
- HVAC 216 Systems Installation and Start Up (3 credits)
- HVAC 221 Commercial Refrigeration (3 credits)
- ENG 221 Public Speaking OR ENG 216 Technical Writing (3 credits)
- Humanities Elective (3 credits)
Semester 4
- HVAC 256 Load Calculations (3 credits)
- HVAC 261 Controls of HVAC (3 credits)
- HVAC 266 Ventilation (3 credits)
- HVAC 271 System Servicing and Troubleshooting (3 credits)
- General Studies Elective (3 credits)
- CIS 105 or CIS 111 (3 credits)
Additional General Education Requirements
- HEAL Elective HEAL 106 or HEAL 111 (1 credit)
Total Credits 74
Faculty
Occupational Advisory Committee
The Occupational Advisory Committee (OAC) serves as a vital link between the Program of study and industry, ensuring that the program remains aligned with current workforce needs, technological advancements, and best practices in the field. Composed of employers, educators, and other community members, the committee provides guidance, feedback, and recommendations to enhance the curriculum, instructional methods, and student learning experiences.
Purpose and Responsibilities:
- Curriculum & Industry Alignment
- Workforce Readiness
- Student & Faculty Support
- Internship & Employment Connections
- Accreditation & Program Evaluation
- Facilities & Equipment Recommendations
By fostering a strong relationship between academia and industry, the OAC helps ensure that Thaddeus Stevens College programs maintain the highest standards in CTE (career and technical education).
- Steve Basgall, Lennox NAS
- James Baxter, High Associates
- Duane Bushong, Arconic
- Ted Christiansen, CSE
- Michael Dell, Clark Services Group, Inc.
- Jeri Donadee, HB McClure
- Daniel Feeser, Johnson Controls Navy Systems
- Dakota Ford, Clark Services Group, Inc.
- Michael Katzenmoyer, Masonic Villages
- Kevin Phipps, Tri-M Group LLC
- Bill Ronayne, Brandywine Valley Heating & AC
- Gary Schrift, International Institute of All-Natural Refrigeration
- Brian Shimp, JK Mechanical
- Stephanie Steffy, Rhoads Air (Rhoads Energy)
- William Vanderslice, Brandywine Valley Heating & AC
- Todd Wagstaff, Landis Bonfitto Mechanical Group
- Eric D. Weik, Johnstone Supply/Wallace Group
- Greg Weikel, Swartley Bros. Engineers, Inc.
Essential Skills Learned
Tasks
- Test electrical circuits or components for continuity, using electrical test equipment.
- Test pipe or tubing joints or connections for leaks, using pressure gauge or soap-and-water solution.
- Join pipes or tubing to equipment and to fuel, water, or refrigerant source, to form a complete circuit.
- Reassemble and test equipment following repairs.
- Repair or replace defective equipment, components, or wiring.
- Layout and connect electrical wiring between controls and equipment, according to wiring diagrams, using electrician’s hand tools.
- Obtain and maintain required certifications.
- Install, connect, and adjust thermostats, humidistats, and timers, using hand tools.
- Comply with all applicable standards, policies, and procedures, including safety procedures and the maintenance of a clean work area.
- Inspect and test systems to verify system compliance with plans and specifications or to detect and locate malfunctions.
Tools used in this occupation
- Hammers – Claw hammers; Soft face hammers; Tinners hammers
- Power saws – Circular saws; Jigsaws; Power hacksaws; Reciprocating saws
- Pressure indicators – Differential pressure detectors; Pneumatic air gauges; Refrigerant pressure meters; Water pressure gauges
- Screwdrivers – Flared tip screwdrivers; Phillips head screwdrivers; Slotted screwdrivers
- Voltage or current meters – Alternating current AC line splitters; Electrical current meters; Non-contact voltage detectors; Voltmeters
Technology used in this occupation
- Data base user interface and query software — Data entry software; Data logging software; Database software
- Electronic mail software — IBM Notes; Microsoft Exchange; Microsoft Outlook
- Facilities management software — Computerized maintenance management system CMMS; Facility energy management software; Johnson Controls Metasys; ManagerPlus
- Industrial control software — Alerton Ascent Compass; Building automation software; Honeywell WEBs-N4; Siemens APOGEE Building Automation Software
- Presentation software — Microsoft PowerPoint
Knowledge
- Mechanical – Knowledge of machines and tools, including their designs, uses, repair, and maintenance.
- Customer and Personal Service – Knowledge of principles and processes for providing customer and personal services. This includes customer needs assessment, meeting quality standards for services, and evaluation of customer satisfaction.
- Mathematics – Knowledge of arithmetic, algebra, geometry, calculus, statistics, and their applications.
- Building and Construction – Knowledge of materials, methods, and the tools involved in the construction or repair of houses, buildings, or other structures such as highways and roads.
- Public Safety and Security – Knowledge of relevant equipment, policies, procedures, and strategies to promote effective local, state, or national security operations for the protection of people, data, property, and institutions.
- Education and Training – Knowledge of principles and methods for curriculum and training design, teaching and instruction for individuals and groups, and the measurement of training effects.
- Engineering and Technology – Knowledge of the practical application of engineering science and technology. This includes applying principles, techniques, procedures, and equipment to the design and production of various goods and services.
- Design – Knowledge of design techniques, tools, and principles involved in the production of precision technical plans, blueprints, drawings, and models.
- English Language – Knowledge of the structure and content of the English language including the meaning and spelling of words, rules of composition, and grammar.
- Physics – Knowledge, and prediction of physical principles, laws, their interrelationships, and applications to understanding fluid, material, and atmospheric dynamics, and mechanical, electrical, atomic, and subatomic structures and processes.
Skills
- Installation – Installing equipment, machines, wiring, or programs to meet specifications.
- Troubleshooting – Determining causes of operating errors and deciding what to do about it.
- Repairing – Repairing machines or systems using the needed tools.
- Equipment Maintenance – Performing routine maintenance on equipment and determining when and what kind of maintenance is needed.
- Operation Monitoring – Watching gauges, dials, or other indicators to make sure a machine is working properly.
- Quality Control Analysis – Conducting tests and inspections of products, services, or processes to evaluate quality or performance.
- Active Listening – Giving full attention to what other people are saying, taking time to understand the points being made, asking questions as appropriate, and not interrupting at inappropriate times.
- Critical Thinking – Using logic and reasoning to identify the strengths and weaknesses of alternative solutions, conclusions, or approaches to problems.
- Operation and Control – Controlling operations of equipment or systems.
- Judgment and Decision Making – Considering the relative costs and benefits of potential actions to choose the most appropriate one.
Abilities
- Near Vision – The ability to see details at close range (within a few feet of the observer).
- Problem Sensitivity – The ability to tell when something is wrong or is likely to go wrong. It does not involve solving the problem, only recognizing there is a problem.
- Finger Dexterity – The ability to make precisely coordinated movements of the fingers of one or both hands to grasp, manipulate, or assemble very small objects.
- Perceptual Speed – The ability to quickly and accurately compare similarities and differences among sets of letters, numbers, objects, pictures, or patterns. The things to be compared may be presented at the same time or one after the other. This ability also includes comparing a presented object with a remembered object.
- Visualization – The ability to imagine how something will look after it is moved around or when its parts are moved or rearranged.
- Extent Flexibility – The ability to bend, stretch, twist, or reach with your body, arms, and/or legs.
- Manual Dexterity – The ability to quickly move your hand, your hand together with your arm, or your two hands to grasp, manipulate, or assemble objects.
- Multilimb Coordination – The ability to coordinate two or more limbs (for example, two arms, two legs, or one leg and one arm) while sitting, standing, or lying down. It does not involve performing the activities while the whole body is in motion.
- Trunk Strength – The ability to use your abdominal and lower back muscles to support part of the body repeatedly or continuously over time without ‘giving out’ or fatiguing.
- Arm-Hand Steadiness – The ability to keep your hand and arm steady while moving your arm or while holding your arm and hand in one position.
Work Activities
- Performing General Physical Activities – Performing physical activities that require considerable use of your arms and legs and moving your whole body, such as climbing, lifting, balancing, walking, stooping, and handling of materials.
- Making Decisions and Solving Problems – Analyzing information and evaluating results to choose the best solution and solve problems.
- Handling and Moving Objects – Using hands and arms in handling, installing, positioning, and moving materials, and manipulating things.
- Getting Information – Observing, receiving, and otherwise obtaining information from all relevant sources.
- Inspecting Equipment, Structures, or Material – Inspecting equipment, structures, or materials to identify the cause of errors or other problems or defects.
- Repairing and Maintaining Mechanical Equipment – Servicing, repairing, adjusting, and testing machines, devices, moving parts, and equipment that operate primarily on the basis of mechanical (not electronic) principles.
- Identifying Objects, Actions, and Events – Identifying information by categorizing, estimating, recognizing differences or similarities, and detecting changes in circumstances or events.
- Updating and Using Relevant Knowledge – Keeping up-to-date technically and applying new knowledge to your job.
- Operating Vehicles, Mechanized Devices, or Equipment – Running, maneuvering, navigating, or driving vehicles or mechanized equipment, such as forklifts, passenger vehicles, aircraft, or watercraft.
- Monitor Processes, Materials, or Surroundings – Monitoring and reviewing information from materials, events, or the environment, to detect or assess problems.
Work Context
- In an Enclosed Vehicle or Equipment – How often does this job require working in a closed vehicle or equipment (e.g., car)?
- Exposed to Hazardous Equipment – How often does this job require exposure to hazardous equipment?
- Face-to-Face Discussions – How often do you have to have face-to-face discussions with individuals or teams in this job?
- Telephone – How often do you have telephone conversations in this job?
- Exposed to Hazardous Conditions – How often does this job require exposure to hazardous conditions?
- Contact With Others – How much does this job require the worker to be in contact with others (face-to-face, by telephone, or otherwise) in order to perform it?
- Outdoors, Exposed to Weather – How often does this job require working outdoors, exposed to all weather conditions?
- Wear Common Protective or Safety Equipment such as Safety Shoes, Glasses, Gloves, Hearing Protection, Hard Hats, or Life Jackets – How much does this job require wearing common protective or safety equipment such as safety shoes, glasses, gloves, hard hats, or life jackets?
- Extremely Bright or Inadequate Lighting – How often does this job require working in extremely bright or inadequate lighting conditions?
- Indoors, Not Environmentally Controlled – How often does this job require working indoors in non-controlled environmental conditions (e.g., warehouse without heat)?
Interests
- Realistic – Realistic occupations frequently involve work activities that include practical, hands-on problems, and solutions. They often deal with plants, animals, and real-world materials like wood, tools, and machinery. Many of the occupations require working outside and do not involve a lot of paperwork or working closely with others.
- Conventional – Conventional occupations frequently involve following set procedures and routines. These occupations can include working with data and details more than with ideas. Usually, there is a clear line of authority to follow.
- Investigative – Investigative occupations frequently involve working with ideas and require an extensive amount of thinking. These occupations can involve searching for facts and figuring out problems mentally.
Work Styles
- Dependability – Job requires being reliable, responsible, and dependable, and fulfilling obligations.
- Attention to Detail – Job requires being careful about detail and thorough in completing work tasks.
- Cooperation – Job requires being pleasant with others on the job and displaying a good-natured, cooperative attitude.
- Integrity – Job requires being honest and ethical.
- Self-Control – Job requires maintaining composure, keeping emotions in check, controlling anger, and avoiding aggressive behavior, even in very difficult situations.
- Persistence – Job requires persistence in the face of obstacles.
- Analytical Thinking – Job requires analyzing information and using logic to address work-related issues and problems.
- Initiative – Job requires a willingness to take on responsibilities and challenges.
- Stress Tolerance – Job requires accepting criticism and dealing calmly and effectively with high-stress situations.
- Achievement/Effort – Job requires establishing and maintaining personally challenging achievement goals and exerting effort toward mastering tasks.
Work Values
- Support – Occupations that satisfy this work value offer supportive management that stands behind employees. Corresponding needs are Company Policies, Supervision: Human Relations, and Supervision: Technical.
- Independence – Occupations that satisfy this work value allow employees to work on their own and make decisions. Corresponding needs are Creativity, Responsibility, and Autonomy.
- Working Conditions – Occupations that satisfy this work value offer job security and good working conditions. Corresponding needs are Activity, Compensation, Independence, Security, Variety, and Working Conditions.
Performance Measures
Internal Key Performance Indicators (Sources: Internal data collections, and Post-Graduate Surveys)
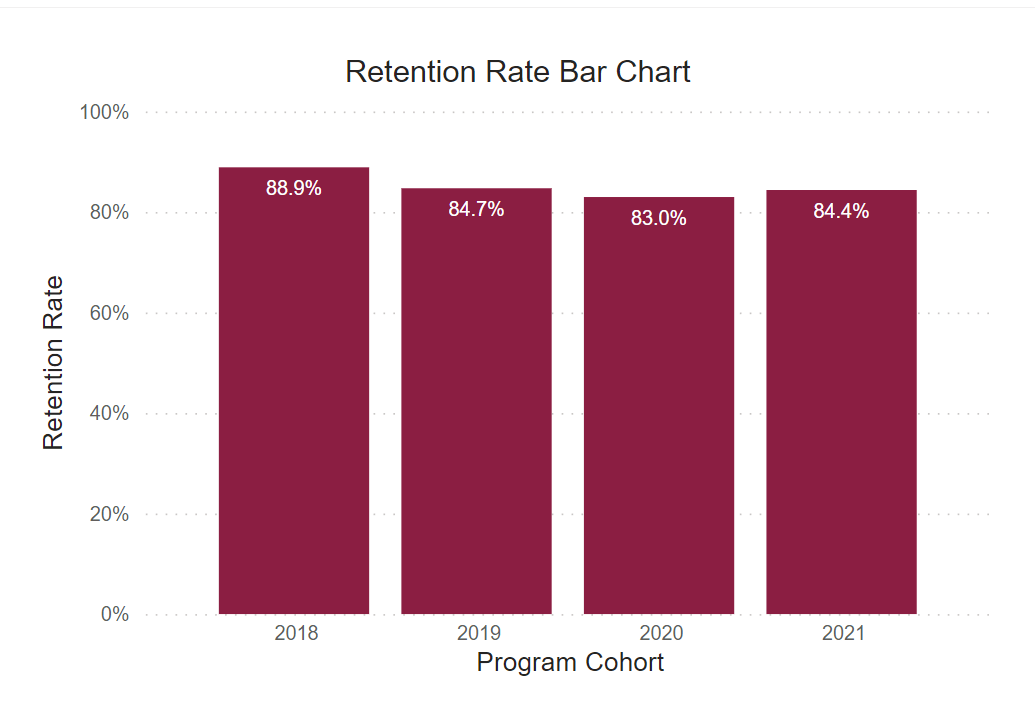
Retention Rate
This rate reflects the continuous term-to-term persistence rate for certificate programs and the fall-to-fall retention rate for associate degree programs.
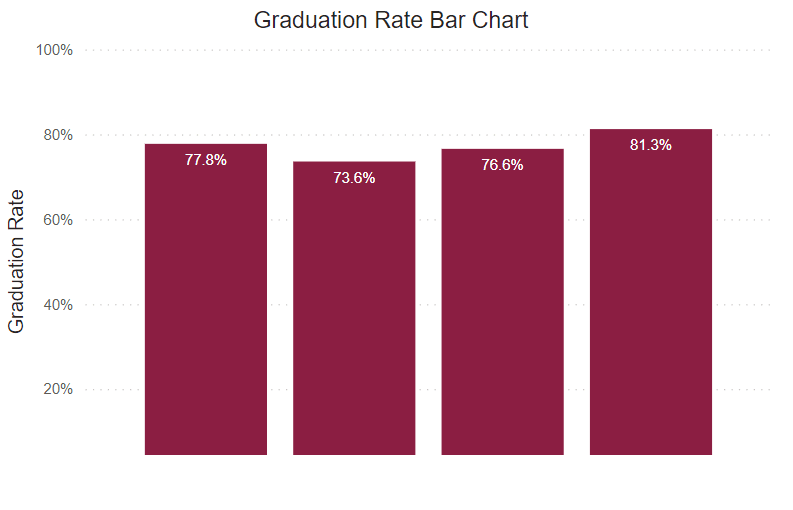
Graduation Rate
This rate reflects the number of freshmen who were officially enrolled in the fall semester and earned a certificate or degree within the expected timeframe.
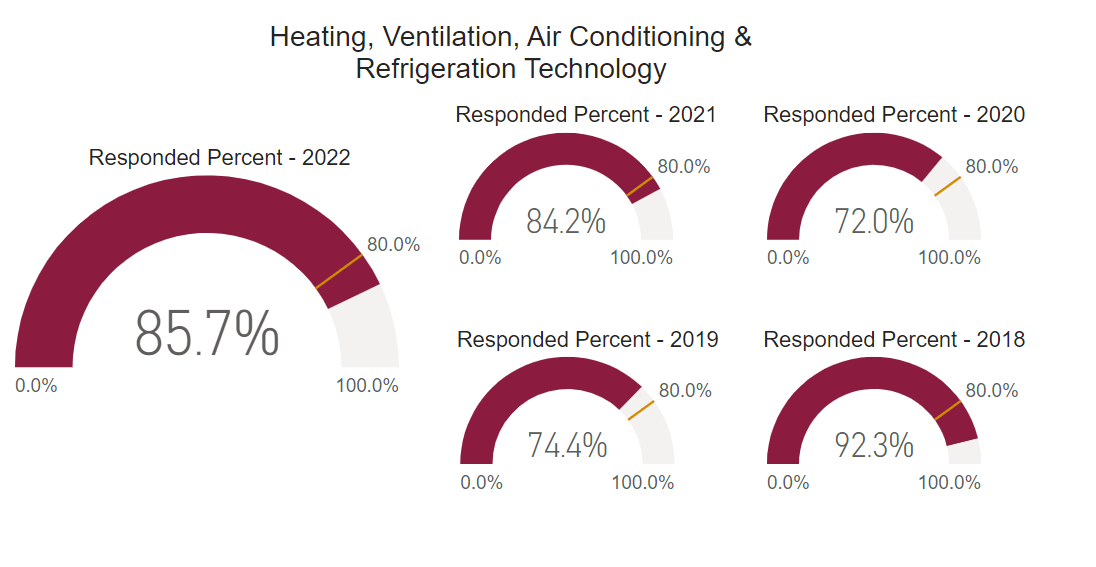
Post Graduate Survey Response Rate
The post graduate survey is an annual on-line post graduate survey utilized by the college to gather vital information regarding career placement, starting salary, and level of satisfaction.
Employed Full Time Outside of Major
Percentage of graduates who reported being employed full-time outside their field of study.
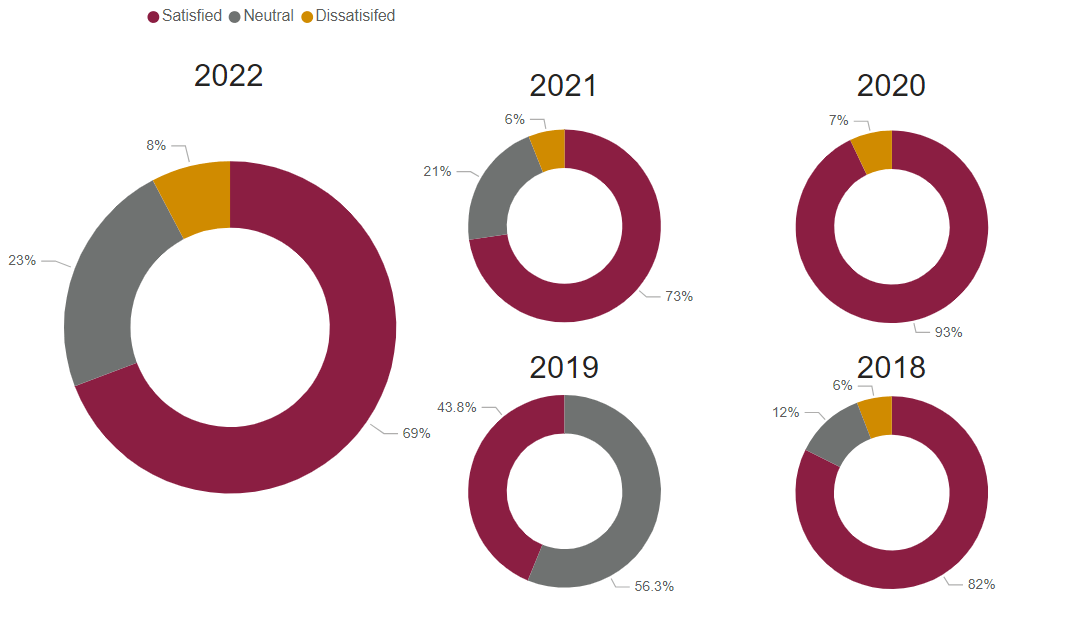
Graduate Satisfaction
This is the median graduate survey response evaluating the level of preparation for workforce entry (based on a 5-Item Likert Scale).
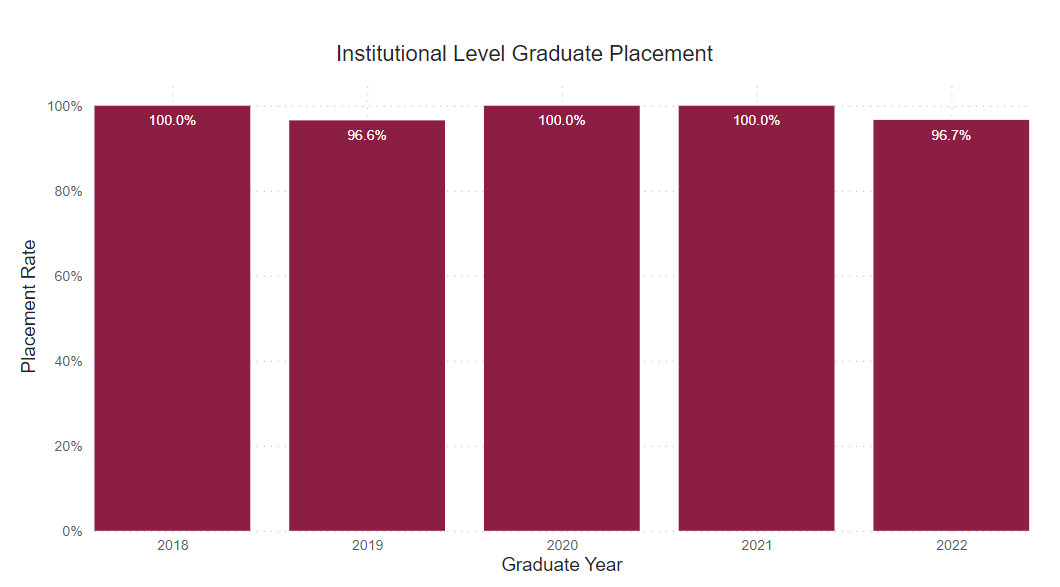
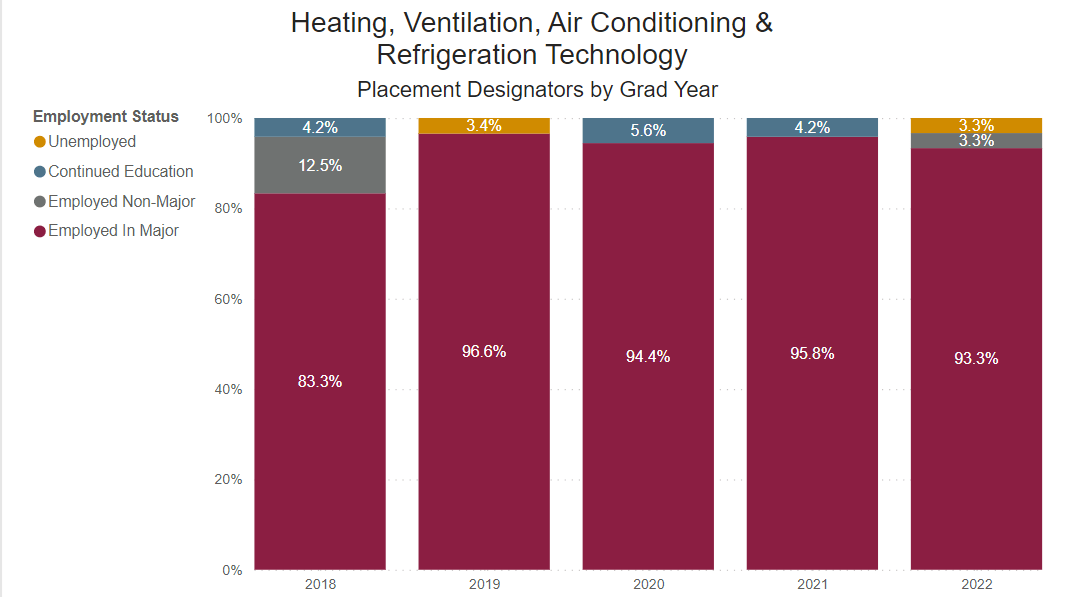
Placement Rate
This is the percent of graduate survey respondents who reported being employed or continued their education on a full-time basis.
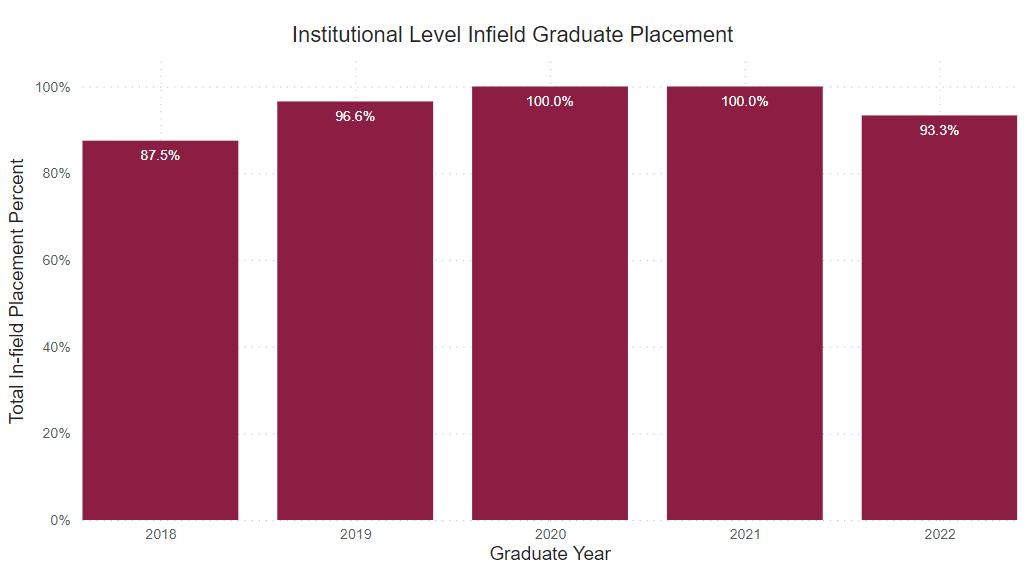
Employed Full Time Within Major
Percentage of graduates who reported being employed full-time within their field of study.
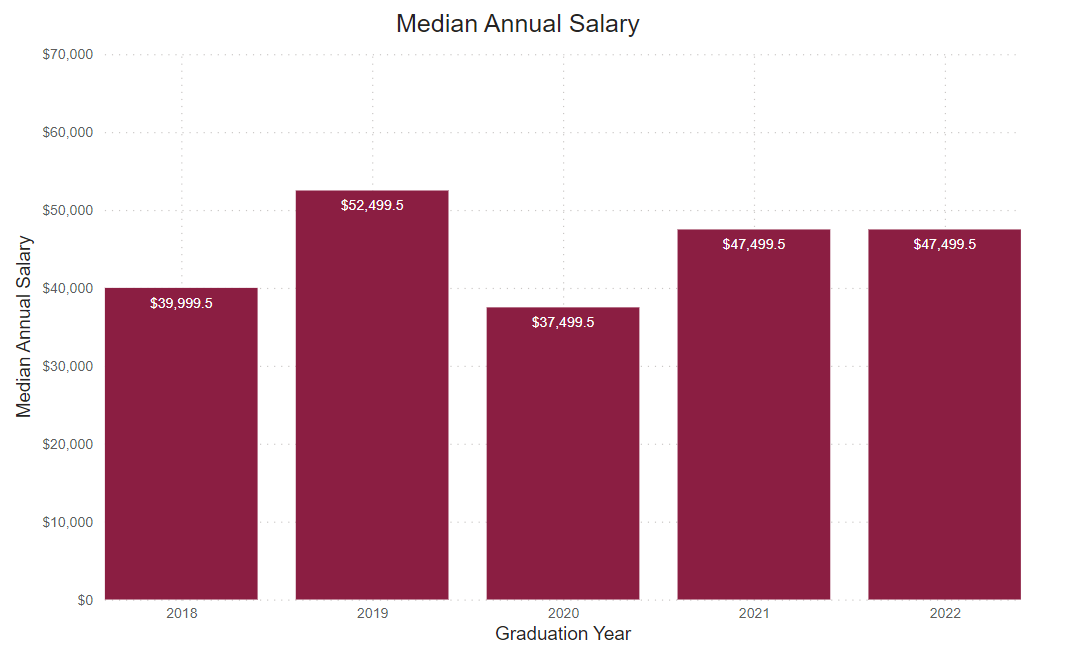
Annual Median Starting Salary
This number is based on the graduate survey response to the request to identify a starting salary from a range of options. This graph shows the median first-year annual salary. All calculations are based on the respondent’s self-reported first-year annual income.
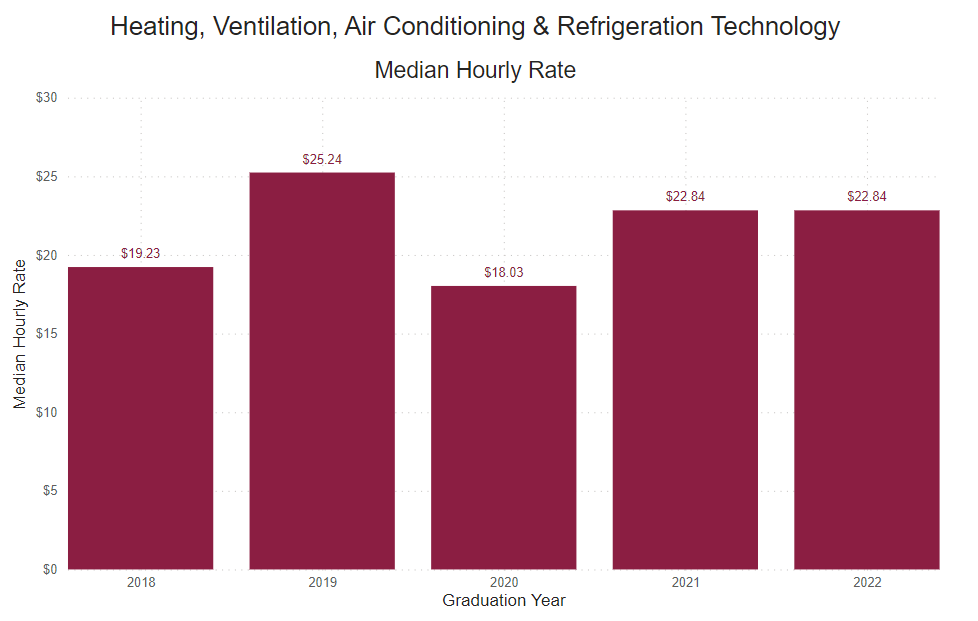
Reported Hourly Rate
This number is determined by dividing the reported median salary by the number of hours in a traditional full-time work week (40), then the number of weeks in a year (52).
Our graduates work with the industry’s best

