Masonry Construction Technology
Get started today
About Masonry Construction Technology
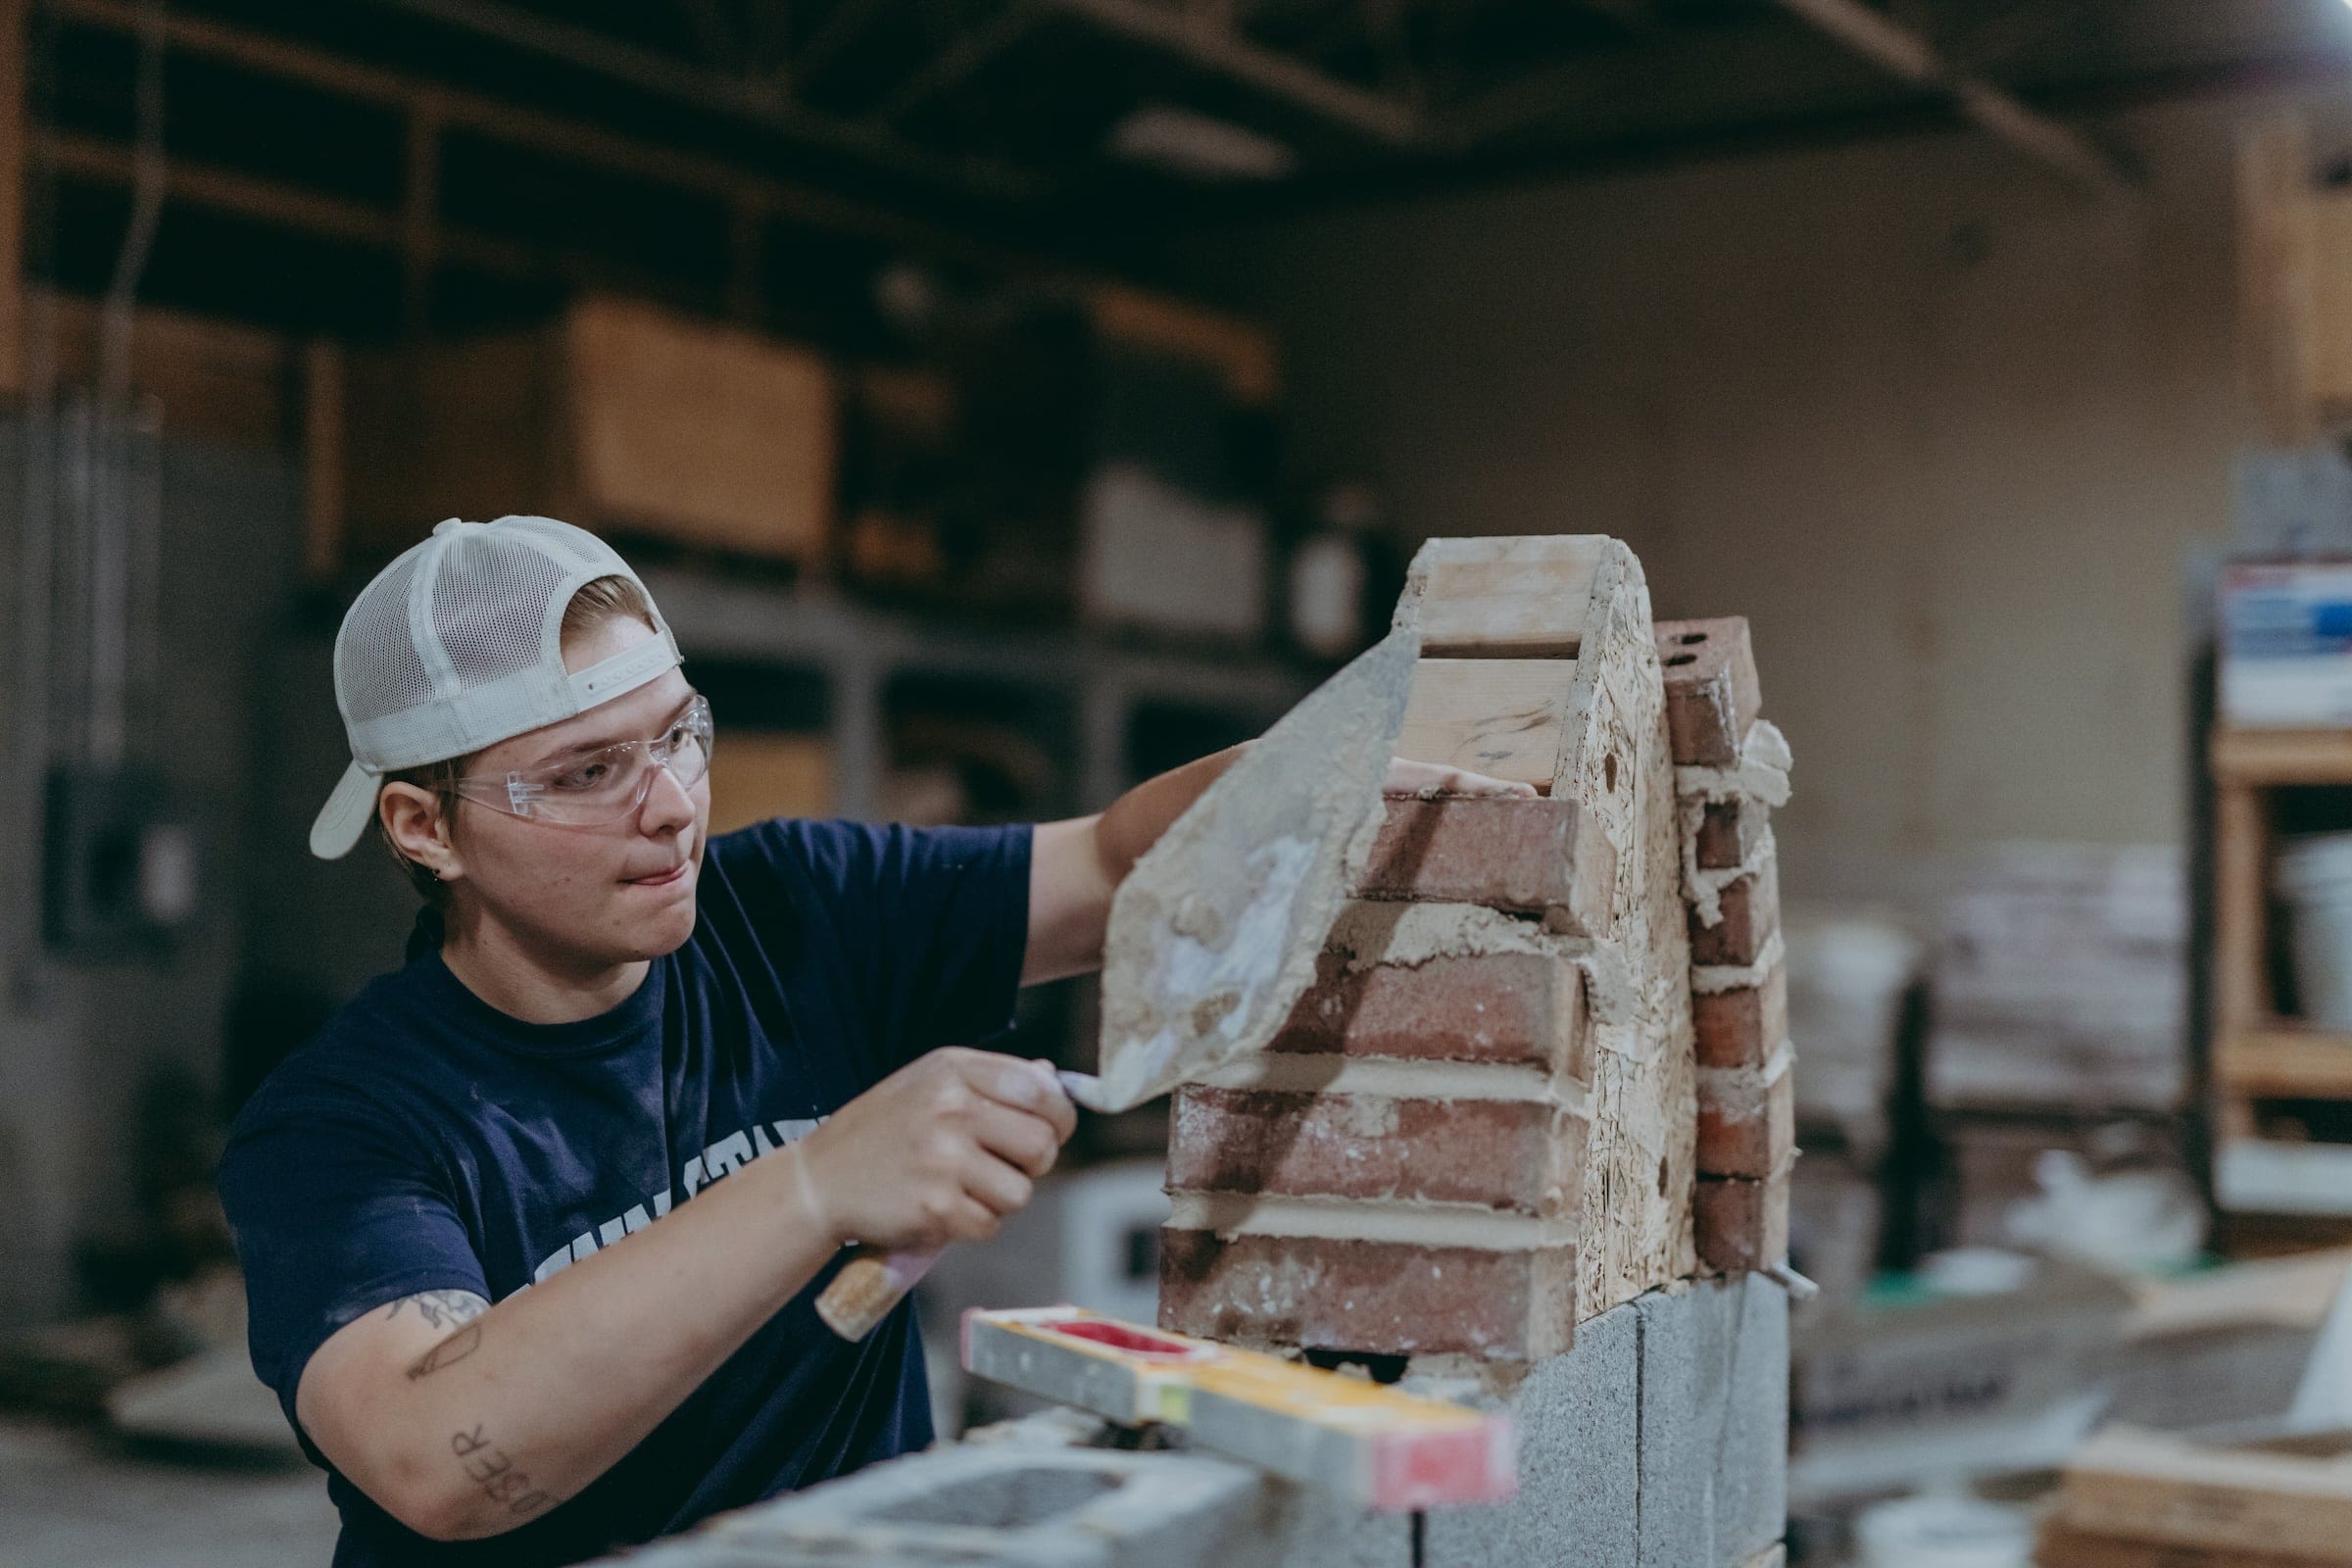
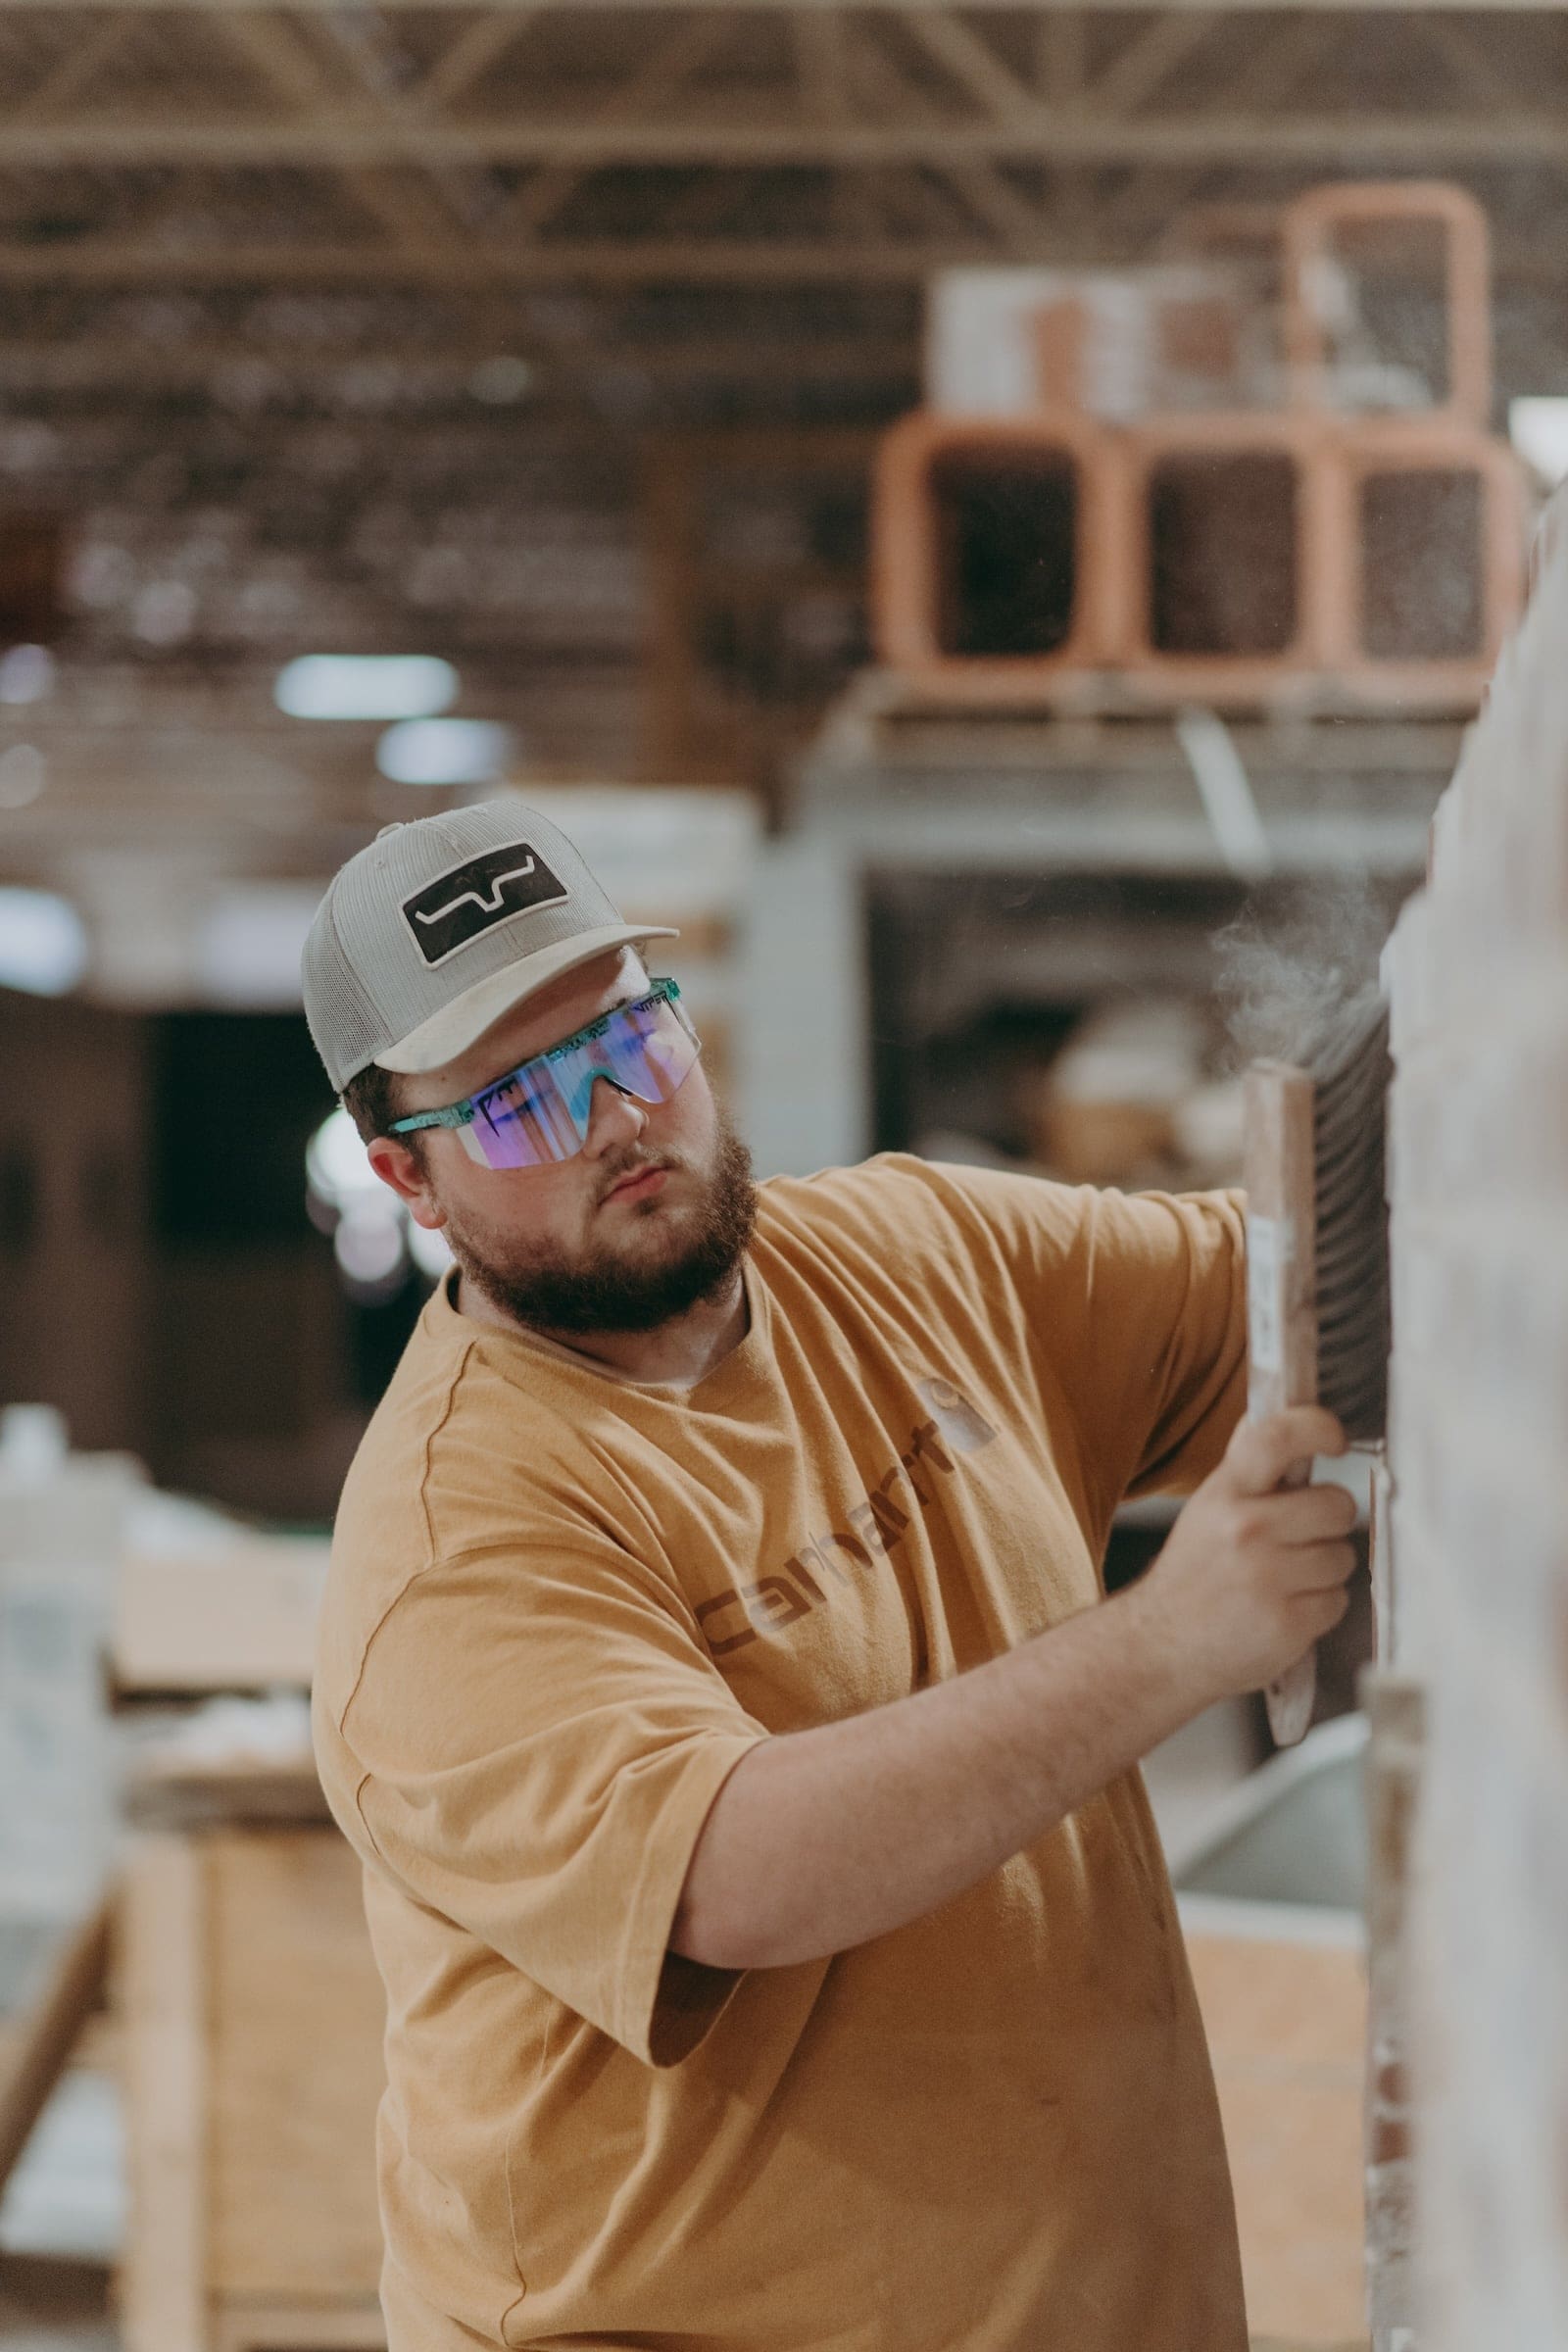
Masonry Construction Technology provides the opportunity to develop the skills of a proficient mason, from the simple spreading of mortar to the complex construction of an inside fireplace. These skills are developed by practice projects, which are preceded by theory lectures and demonstrations. Faculty members show films on various aspects of the trade, and students take field trips to learn about the manufacture of masonry products.
Since a large part of masonry work is decorative as well as functional, special emphasis is placed on appreciation of the beauty and permanence of brickwork and on the development of pride in good workmanship.
Students find employment in the field as masons, and with experience, as forepersons or superintendents. Many masons are self-employed.
What you’ll learn
- Operate masonry tools and equipment safely and effectively.
- Use masonry terminology.
- Read blueprints to estimate materials quantity and pricing.
- Layout and construct footings and build a block foundation.
- Apply brick veneering to a structure.
- Construct a masonry arch.
- Layout and set ceramic tile.
- Construct an inside fireplace and chimney.
- Repair older masonry structures.
- Organize personnel and materials at a construction site.
- Provide all masonry options in current residential construction.
Sample Job Titles
Lay and bind building materials, such as brick, structural tile, concrete block, cinder block, glass block, and terra-cotta block, with mortar and other substances to construct or repair walls, partitions, arches, sewers, and other structures.
Bricklayer, Brick Mason, Mason, Brick Layer, Brick and Block Mason, Block Layer, Brickmason, Concrete Finisher, Tender, Block Mason
Soar Agreement
This program enables students to apply certain credits earned in high school to the credits needed for a degree or certificate through Thaddeus Stevens College. The Masonry Construction Technology degree qualifies for this program – see our SOAR program page for details!
Quick facts
Location
Thaddeus Stevens College at Greenfield
Type of program
Associate Degree
Job/Salary Outlook
See industry data
Length of program
2 years, 73 credits
Cost of program
$4,500/semester tuition
$3,000 – $3,500/semester housing
$1,850 – $2,335/semester meal plan
Tool List (PDF)
The outcomes speak for themselves
Graduates of this program work in architectural and civil drafting and often transfer into programs in nationally accredited universities.
90%
employment
$42.5K
med. salary
10%
cont. ed
People of TSCT
Success stories

Program details
Courses
MODEL SCHEDULE FOR MASONRY CONSTRUCTION TECHNOLOGY
Semester 1
- MASN 101 Intro to Tools, Safety, and Equipment (3 credits)
- MASN 105 Introduction to Masonry Construction (3 credits)
- MASN 110 Development of Masonry Materials (3 credits)
- MASN 116 Chimney Construction (3 credits)
- ENG 106 English Composition (3 credits)
- MATH 126 Technical Mathematics I (or higher) (3 credits)
Semester 2
- MASN 155 Block Construction, Bearings & Anchoring Systems (4 credits)
- MASN 158 Adhered Concrete Masonry Veneer (2 credits)
- MASN 162 Hard-scaping Patios & Retaining Walls (2 credits)
- MASN 167 Masonry Restoration and Building Walls (3 credits)
- MASN 171 Concrete Sidewalks (1 credit)
- CIS 111 Intro to Computer Applications OR
- CIS 105 Drawing with AutoCad (3 credits)
- MATH 132 Elementary Geometry (or higher) (3 credits)
- HEAL 111 Basic First Aid (1 credit)
Semester 3
- MASN 207 Advanced Masonry Applications (5 credits)
- MASN 213 Planning and Management (3 credits)
- MASN 216 Blueprint Reading and Estimating (4 credits)
- ENG 221 Public Speaking, OR
- ENG 216 Technical Writing (3 credits)
- Science Elective (3 credits)
Semester 4
- MASN 256 Fireplace Construction (4 credits)
- MASN 261 Arch Construction (3 credits)
- MASN 266 Tile Setting (2 credits)
- MASN 271 Footings and Foundations (3 credits)
- Humanities Elective (3 credits)
- BUSN 106 Small Business Management (3 credits)
Total Credits 73
Faculty
Occupational Advisory Committee
The Occupational Advisory Committee (OAC) serves as a vital link between the Program of study and industry, ensuring that the program remains aligned with current workforce needs, technological advancements, and best practices in the field. Composed of employers, educators, and other community members, the committee provides guidance, feedback, and recommendations to enhance the curriculum, instructional methods, and student learning experiences.
Purpose and Responsibilities:
- Curriculum & Industry Alignment
- Workforce Readiness
- Student & Faculty Support
- Internship & Employment Connections
- Accreditation & Program Evaluation
- Facilities & Equipment Recommendations
By fostering a strong relationship between academia and industry, the OAC helps ensure that Thaddeus Stevens College programs maintain the highest standards in CTE (career and technical education).
- Matt Arnold, Restoration East LLC
- Karen Baires, Retro Environmental
- Dwayne Borowski, BAC Local 5
- Frank Cicero, NR Weaver
- Paul Devine, D.J. Cross Inc.
- Jane Dropeskey, Paradise Masonry
- Michael Feo, Eshbach Brothers, L.P.
- Elisa Ford, SEPTA
- Debbie Mecklie, The Witmer Group
- Doug Minnick, Minnick Wall Solutions
- Cali Mulzet, Harris Miniature Golf Courses
- Alyssa Murillo, Houck
- David Porter, LV Concrete
- Andy Robbins, Oldcastle APG
- Chris Seasock, The Witmer Group
- Doug Shaffer, York Building Products
- Cristina Velez, Wagman, Inc.
- Jake Zook, Cambridge Masonry LLC
Essential Skills Learned
Prepare detailed drawings of architectural and structural features of buildings or drawings and topographical relief maps used in civil engineering projects, such as highways, bridges, and public works. Use knowledge of building materials, engineering practices, and mathematics to complete drawings.
Tasks
- Remove excess mortar with trowels and hand tools, and finish mortar joints with jointing tools, for a sealed, uniform appearance.
- Construct corners by fastening in plumb position a corner pole or building a corner pyramid of bricks, and filling in between the corners using a line from corner to corner to guide each course, or layer, of brick.
- Measure distance from reference points and mark guidelines to lay out work, using plumb bobs and levels.
- Break or cut bricks, tiles, or blocks to size, using a trowel edge, hammer, or power saw.
- Interpret blueprints and drawings to determine specifications and to calculate the materials required.
- Fasten or fuse brick or other building material to structure with wire clamps, anchor holes, torch, or cement.
- Lay and align bricks, blocks, or tiles to build or repair structures or high-temperature equipment, such as cupola, kilns, ovens, or furnaces.
- Mix specified amounts of sand, clay, dirt, or mortar powder with water to form refractory mixtures.
- Calculate angles and courses and determine the vertical and horizontal alignment of courses.
- Clean working surface to remove scale, dust, soot, or chips of brick and mortar, using a broom, wire brush, or scraper.
Tools used in this occupation
- Hammers — Claw hammers; Sledgehammers; Striking tools; Tile hammers
- Jacks — Hydraulic jacks; Screw jacks
- Levels — Laser levels; Masonry levels; Water levels
- Manlift or personnel lift — Bosun chairs; Swing stages; Work cages
- Plaster or mortar mixers — Cement mixers; Mixing drills; Mortar mixers
- Power saws — Circular saws; Jigsaws; Masonry saws
- Trowels — Adhesive trowels; Pointing trowels; Power trowels; Sled runner jointers
Technology used in this occupation
- Accounting software — Intuit QuickBooks software
- Analytical or scientific software — Construction Management Software ProEst
- Project management software — BVH Gregg Concrete; Daystar Masonry; RISA Technologies RISAMasonry; Tradesman’s Software Master Estimator
Knowledge
- Building and Construction — Knowledge of materials, methods, and the tools involved in the construction or repair of houses, buildings, or other structures such as highways and roads.
- Mathematics — Knowledge of arithmetic, algebra, geometry, calculus, statistics, and their applications.
- Mechanical — Knowledge of machines and tools, including their designs, uses, repair, and maintenance.
- Customer and Personal Service — Knowledge of principles and processes for providing customer and personal services. This includes customer needs assessment, meeting quality standards for services, and evaluation of customer satisfaction.
- Administration and Management — Knowledge of business and management principles involved in strategic planning, resource allocation, human resources modeling, leadership technique, production methods, and coordination of people and resources.
- Design — Knowledge of design techniques, tools, and principles involved in the production of precision technical plans, blueprints, drawings, and models.
- Education and Training — Knowledge of principles and methods for curriculum and training design, teaching and instruction for individuals and groups, and the measurement of training effects.
- Public Safety and Security — Knowledge of relevant equipment, policies, procedures, and strategies to promote effective local, state, or national security operations for the protection of people, data, property, and institutions.
- Production and Processing — Knowledge of raw materials, production processes, quality control, costs, and other techniques for maximizing the effective manufacture and distribution of goods.
Skills
- Critical Thinking — Using logic and reasoning to identify the strengths and weaknesses of alternative solutions, conclusions, or approaches to problems.
- Monitoring — Monitoring/Assessing performance of yourself, other individuals, or organizations to make improvements or take corrective action.
- Coordination — Adjusting actions in relation to others’ actions.
- Quality Control Analysis — Conducting tests and inspections of products, services, or processes to evaluate quality or performance.
- Time Management — Managing one’s own time and the time of others.
- Judgment and Decision Making — Considering the relative costs and benefits of potential actions to choose the most appropriate one.
Abilities
- Manual Dexterity — The ability to quickly move your hand, your hand together with your arm, or your two hands to grasp, manipulate, or assemble objects.
- Static Strength — The ability to exert maximum muscle force to lift, push, pull, or carry objects.
- Trunk Strength — The ability to use your abdominal and lower back muscles to support part of the body repeatedly or continuously over time without ‘giving out’ or fatiguing.
- Arm-Hand Steadiness — The ability to keep your hand and arm steady while moving your arm or while holding your arm and hand in one position.
- Dynamic Strength — The ability to exert muscle force repeatedly or continuously over time. This involves muscular endurance and resistance to muscle fatigue.
- Extent Flexibility — The ability to bend, stretch, twist, or reach with your body, arms, and/or legs.
- Multilimb Coordination — The ability to coordinate two or more limbs (for example, two arms, two legs, or one leg and one arm) while sitting, standing, or lying down. It does not involve performing the activities while the whole body is in motion.
- Near Vision — The ability to see details at close range (within a few feet of the observer).
- Visualization — The ability to imagine how something will look after it is moved around or when its parts are moved or rearranged.
- Finger Dexterity — The ability to make precisely coordinated movements of the fingers of one or both hands to grasp, manipulate, or assemble very small objects.
Work Activities
- Handling and Moving Objects — Using hands and arms in handling, installing, positioning, and moving materials, and manipulating things.
- Performing General Physical Activities — Performing physical activities that require considerable use of your arms and legs and moving your whole body, such as climbing, lifting, balancing, walking, stooping, and handling of materials.
- Inspecting Equipment, Structures, or Material — Inspecting equipment, structures, or materials to identify the cause of errors or other problems or defects.
- Operating Vehicles, Mechanized Devices, or Equipment — Running, maneuvering, navigating, or driving vehicles or mechanized equipment, such as forklifts, passenger vehicles, aircraft, or watercraft.
- Making Decisions and Solving Problems — Analyzing information and evaluating results to choose the best solution and solve problems.
- Organizing, Planning, and Prioritizing Work — Developing specific goals and plans to prioritize, organize, and accomplish your work.
- Coordinating the Work and Activities of Others — Getting members of a group to work together to accomplish tasks.
- Monitor Processes, Materials, or Surroundings — Monitoring and reviewing information from materials, events, or the environment, to detect or assess problems.
- Getting Information — Observing, receiving, and otherwise obtaining information from all relevant sources.
- Controlling Machines and Processes — Using either control mechanisms or direct physical activity to operate machines or processes (not including computers or vehicles).
Work Context
- Wear Common Protective or Safety Equipment such as Safety Shoes, Glasses, Gloves, Hearing Protection, Hard Hats, or Life Jackets — 100% responded “Every day.”
- Outdoors, Exposed to Weather — 97% responded “Every day.”
- Spend Time Standing — 86% responded “Continually or almost continually.”
- Exposed to Hazardous Equipment — 85% responded “Every day.”
- Sounds, Noise Levels Are Distracting or Uncomfortable — 60% responded “Every day.”
- Spend Time Making Repetitive Motions — 59% responded “Continually or almost continually.”
- Very Hot or Cold Temperatures — 58% responded “Every day.”
- Spend Time Using Your Hands to Handle, Control, or Feel Objects, Tools, or Controls
- Physical Proximity — 47% responded “Moderately close (at arm’s length).”
- Exposed to High Places — 51% responded “Once a week or more but not every day.”
Interests
- Realistic — Realistic occupations frequently involve work activities that include practical, hands-on problems, and solutions. They often deal with plants, animals, and real-world materials like wood, tools, and machinery. Many of the occupations require working outside and do not involve a lot of paperwork or working closely with others.
- Conventional — Conventional occupations frequently involve following set procedures and routines. These occupations can include working with data and details more than with ideas. Usually, there is a clear line of authority to follow.
- Investigative — Investigative occupations frequently involve working with ideas and require an extensive amount of thinking. These occupations can involve searching for facts and figuring out problems mentally.
Work Styles
- Attention to Detail — Job requires being careful about detail and thorough in completing work tasks.
- Dependability — Job requires being reliable, responsible, and dependable, and fulfilling obligations.
- Cooperation — Job requires being pleasant with others on the job and displaying a good-natured, cooperative attitude.
- Integrity — Job requires being honest and ethical.
- Adaptability/Flexibility — Job requires being open to change (positive or negative) and to considerable variety in the workplace.
- Achievement/Effort — Job requires establishing and maintaining personally challenging achievement goals and exerting effort toward mastering tasks.
- Analytical Thinking — Job requires analyzing information and using logic to address work-related issues and problems.
- Leadership — Job requires a willingness to lead, take charge, and offer opinions and direction.
- Self-Control — Job requires maintaining composure, keeping emotions in check, controlling anger, and avoiding aggressive behavior, even in very difficult situations.
- Concern for Others — Job requires being sensitive to others’ needs and feelings and being understanding and helpful on the job.
Work Values
- Support — Occupations that satisfy this work value offer supportive management that stands behind employees. Corresponding needs are Company Policies, Supervision: Human Relations, and Supervision: Technical.
- Working Conditions — Occupations that satisfy this work value offer job security and good working conditions. Corresponding needs are Activity, Compensation, Independence, Security, Variety, and Working Conditions.
- Independence — Occupations that satisfy this work value allow employees to work on their own and make decisions. Corresponding needs are Creativity, Responsibility, and Autonomy.
Performance Measures
Internal Key Performance Indicators (Sources: Internal data collections, and Post-Graduate Surveys)
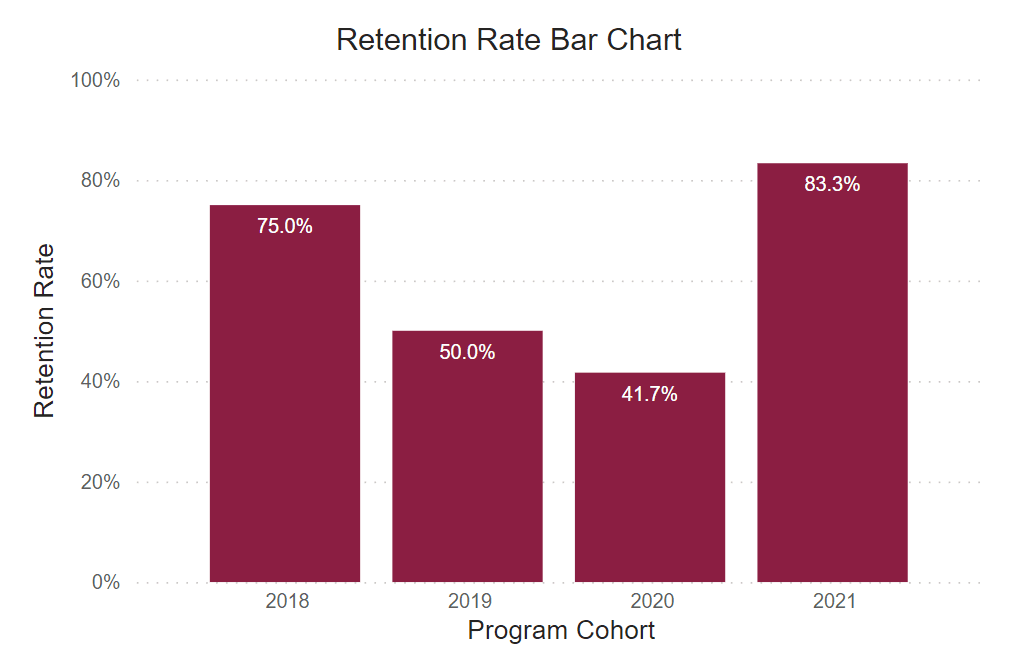
Retention Rate
This rate reflects the continuous term-to-term persistence rate for certificate programs and the fall-to-fall retention rate for associate degree programs.
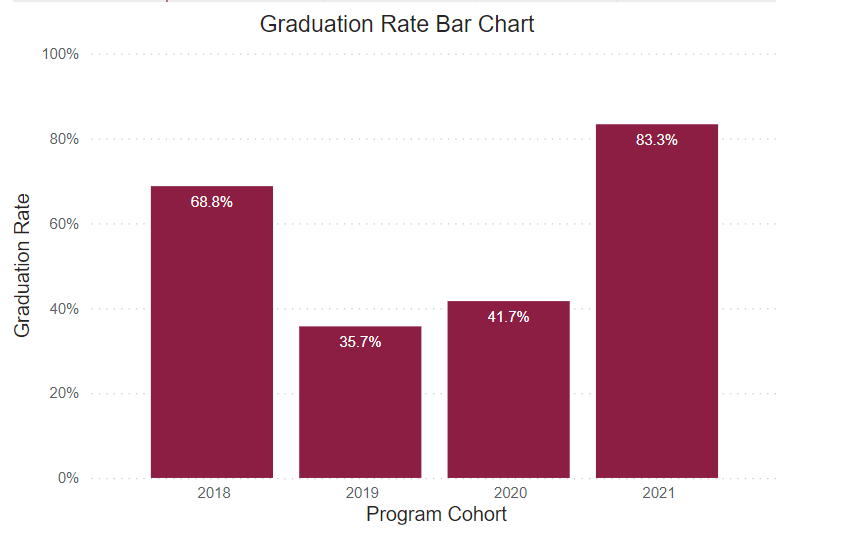
Graduation Rate
This rate reflects the number of freshmen who were officially enrolled in the fall semester and earned a certificate or degree within the expected timeframe.
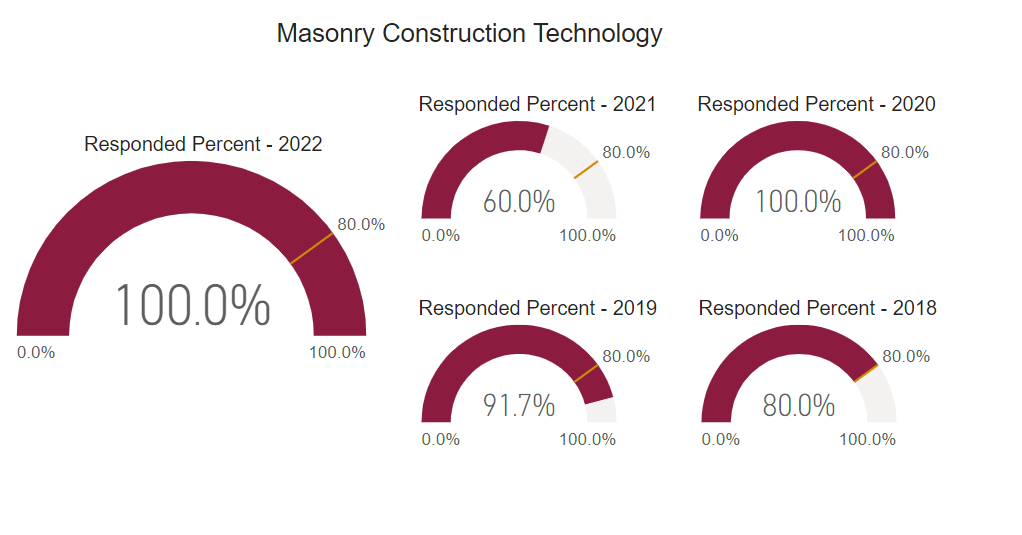
Post Graduate Survey Response Rate
The post graduate survey is an annual on-line post graduate survey utilized by the college to gather vital information regarding career placement, starting salary, and level of satisfaction.
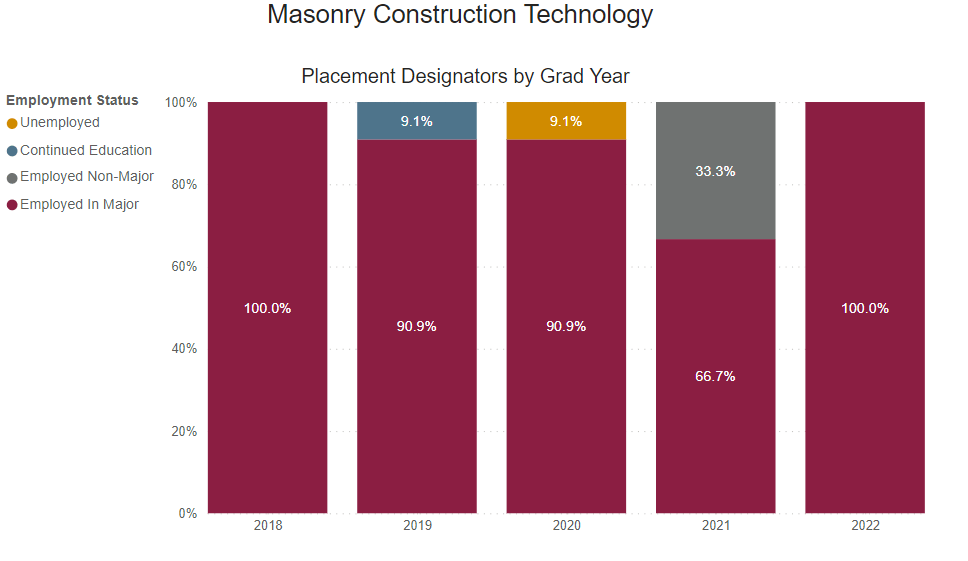
Employed Full Time Outside of Major
Percentage of graduates who reported being employed full-time outside their field of study.
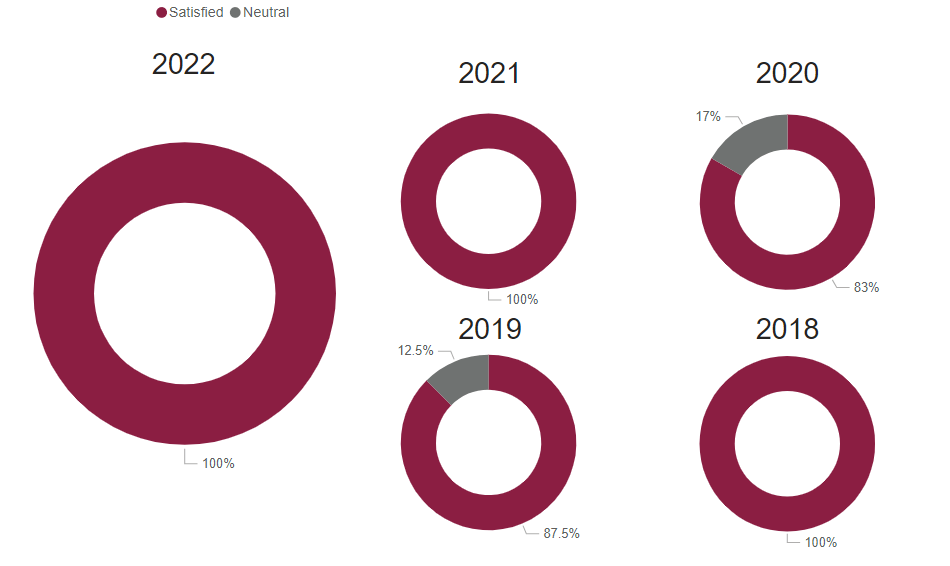
Graduate Satisfaction
This is the median graduate survey response evaluating the level of preparation for workforce entry (based on a 5-Item Likert Scale).
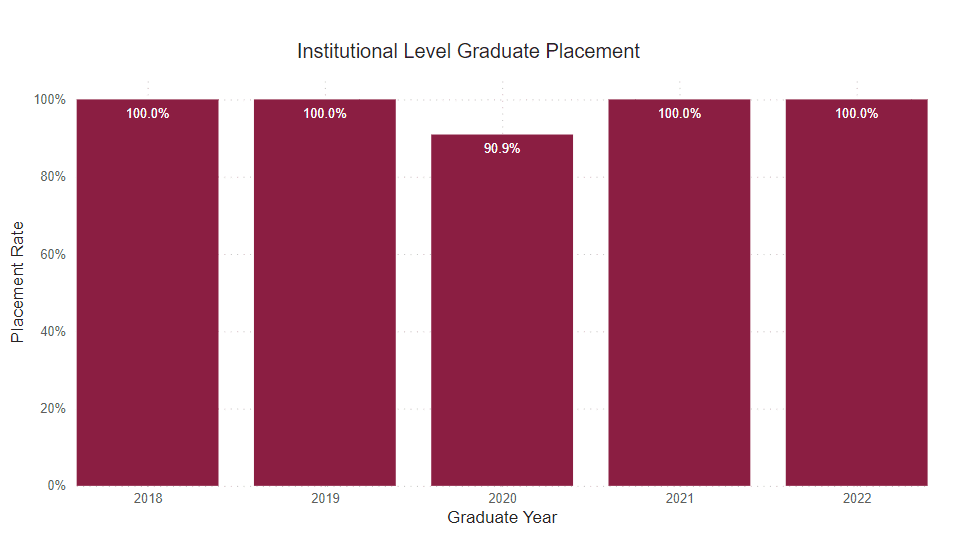
Placement Rate
This is the percent of graduate survey respondents who reported being employed or continued their education on a full-time basis.
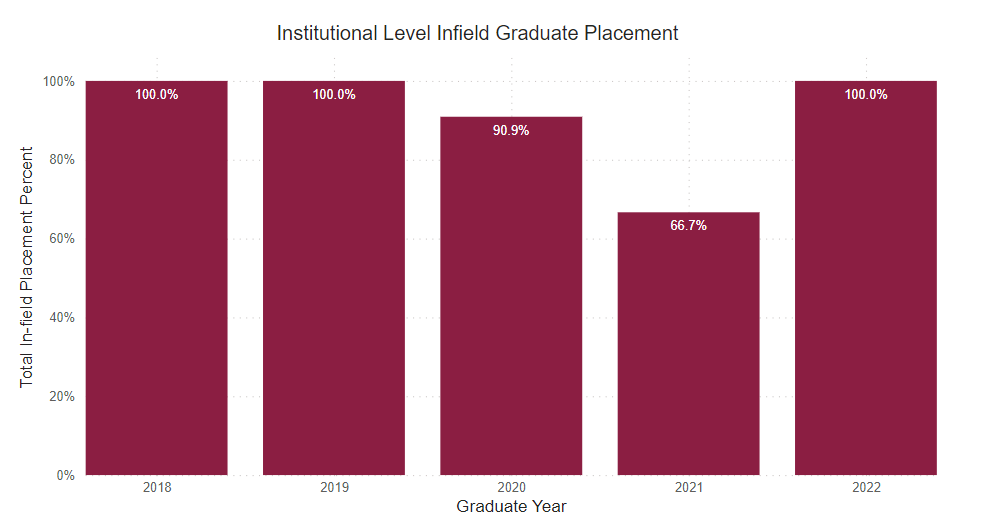
Employed Full Time Within Major
Percentage of graduates who reported being employed full-time within their field of study.
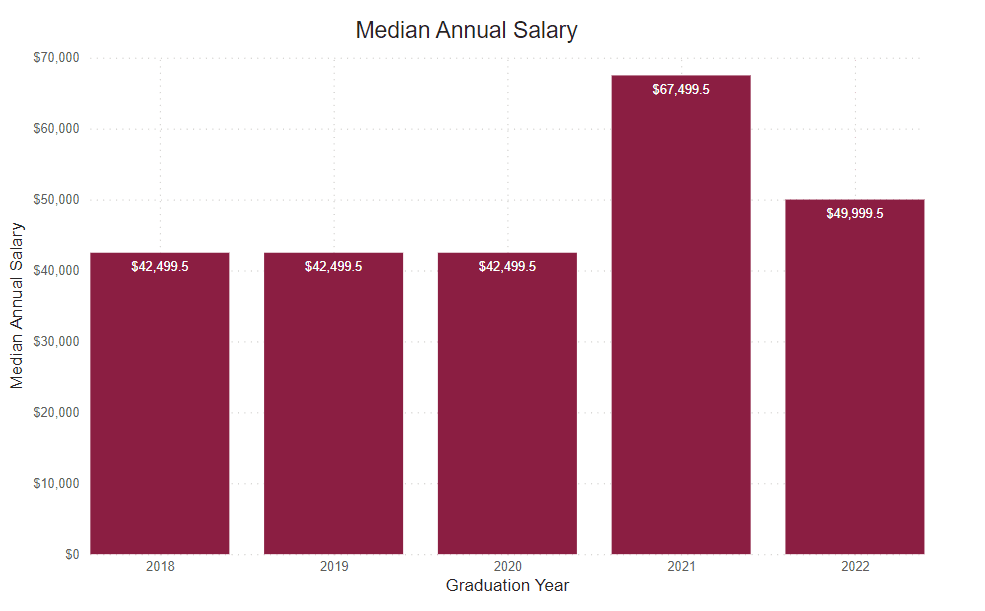
Annual Median Starting Salary
This number is based on the graduate survey response to the request to identify a starting salary from a range of options. This graph shows the median first-year annual salary. All calculations are based on the respondent’s self-reported first-year annual income.
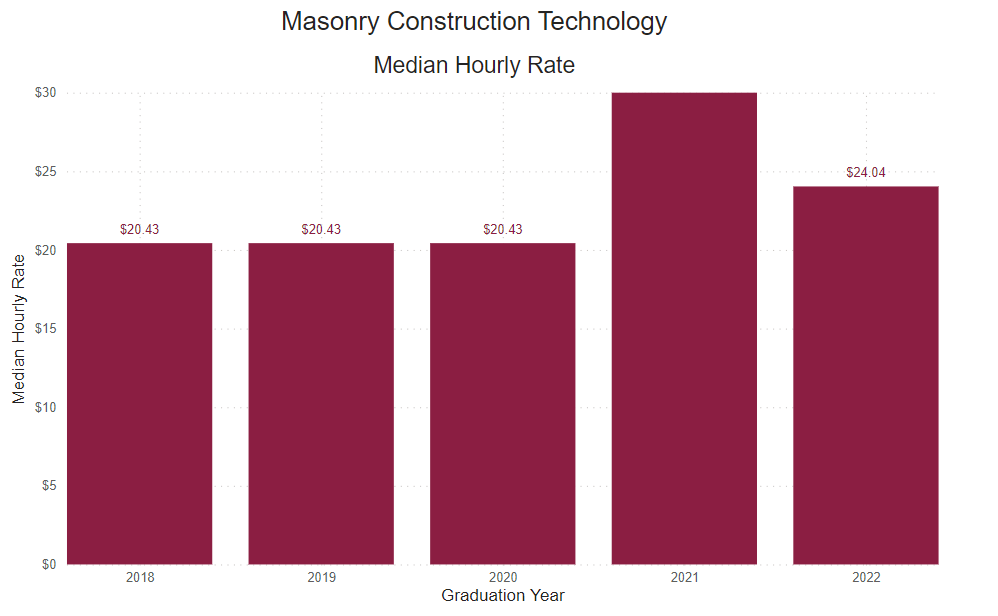
Reported Hourly Rate
This number is determined by dividing the reported median salary by the number of hours in a traditional full-time work week (40), then the number of weeks in a year (52).

Our graduates work with the industry’s best

