
Mechanical Engineering Technology
Get started today
About Mechanical Engineering Technology
The Mechanical Engineering Technology program prepares graduates for entry-level employment in the Mechanical Engineering field. The skills acquired from this course of study allow the student to visualize objects in three dimensions, describe objects with manual and Computer-Aided Drafting (CAD) techniques, and apply Mechanical Engineering principles to design products, tools, and equipment for a manufacturing-oriented industry. The program’s affiliations with industry are maintained through an Advisory Committee and the Society of Manufacturing Engineers (SME).
The student’s skills are developed with a comprehensive exposure to the concepts of orthographic projection, sectioning, and isometric drawing with an emphasis on instrument drawing techniques. A thorough understanding of Geometric Dimensioning and Tolerancing (GD&T) and a demonstrated proficiency with the latest CAD software complement these skills. Additional training in Fabrication Principles, Mechanical Design, Product Design, and Manufacturing Processes provides a well-rounded experience with mechanical design and manufacturing technology.
The principles of Mechanical Engineering are mastered by studying the motion of mechanical objects and the underlying concepts required to understand how a machine functions or a manufacturing process is performed. By studying the practical aspects of structured programming, parametric feature-based design, and solid modeling, the student gains the skills necessary to utilize the computer as a design tool. Further studies in Fluid Mechanics, Production Design, Engineering Materials, Thermodynamics and Heat Transfer, Machine Design, and related engineering topics allow the student to build upon these concepts. Practical applications of these concepts are further realized as the student completes an internship project during the fourth semester.
Upon entering the work place, the graduate can expect to assist engineers and scientists in the design and development of new products. As work experience is acquired, the graduate can expect to gain more design responsibility and thereby become a key member of an engineering team.
What you’ll learn
- Produce detail, subassembly, and full-assembly engineering drawings utilizing manual and computer-aided drafting techniques.
- Recognize and apply the ASME Y14.5 guidelines in the creation of engineering drawings.
- Utilize ASME Y14.5 geometric dimensioning and tolerancing guidelines for establishing and maintaining the functional fit of mating parts.
- Apply industrial practices in the design and fabrication of sheet-metal components, welded assemblies, and piping systems.
- Identify and understand manufacturing processes and their effect on the cost and/or function of manufactured products.
- Analyze and design mechanical parts and systems for static and dynamic loading conditions.
- Apply engineering principles for determining the effects of stationary and moving fluids and the control and transformation of energy.
- Design manufacturing tooling for locating, clamping, forming, piercing, blanking, and/or shaping a given part.
- Employ structured programming techniques and utilize computer software tools to design and analyze mechanical parts or systems.
- Select and apply engineering materials for use in the design and manufacture of mechanical components.
- Analyze and design machine elements such as gears, shafts, bearings, clutches, brakes, flywheels, and related assemblies.
- Apply engineering problem-solving skills to complete a project on time and within budget.
Sample Job Titles
Apply theory and principles of mechanical engineering to modify, develop, test, or calibrate machinery and equipment under the direction of engineering staff or physical scientists.
Engineering Technician, Mechanical Designer, Research and Development Technician, Engineering Lab Technician, Equipment Engineer, Process Technician, Design Engineer, Designer, Engineering Technical Analyst, Lab Technician, Mechanical Drafter, Automotive Engineering Technicians
Quick facts
Location
Griscom Education Center, First Floor (Above lobby level)
Type of program
Associate Degree
Job/Salary Outlook
See industry data
Length of program
2 years, 73 credits
Cost of program
$4,500/semester tuition
$3,000 – $3,500/semester housing
$1,850 – $2,335/semester meal plan
Tool List (PDF)

The outcomes speak for themselves
Upon entering the work place, the graduate can expect to assist engineers and scientists in the design and development of new products. As work experience is acquired, the graduate can expect to gain more design responsibility and thereby become a key member of an engineering team.
57.1%
employment
$62.5K
med. salary
42.9%
cont. education
People of TSCT
Success stories

Program details
Courses
MODEL SCHEDULE FOR MECHANICAL ENGINEERING TECHNOLOGY (OPTION #1)
Semester 1
- MET 101 Drafting Fundamentals (3 credits)
- MET 106 Engineering Graphics (3 credits)
- MET 116 Computer-Aided Drafting (3 credits)
- MET 176 Manufacturing Processes (3 credits)
- MATH 137 Intermediate Algebra (or higher) (3 credits)
- ENG 106 English Composition (3 credits)
Semester 2
- MET 111 Engineering Standards (3 credits)
- MET 161 Fabrication Principles (3 credits)
- MET 166 Mechanical Design (3 credits)
- MET 171 Product Design (3 credits)
- MATH 141 Trigonometry (or higher) (3 credits)
- PHYS 113 Statics (3 credits)
Semester 3
- MET 201 Engineering Mechanics (3 credits)
- MET 206 Fluid Mechanics (3 credits)
- MET 211 Production Design (3 credits)
- MET 216 Parametric Solid Modeling (3 credits)
- ENG 216 Technical Writing (3 credits)
- PHYS 213 General Physics I (4 credits)
Semester 4
- MET 261 Engineering Materials (3 credits)
- MET 266 Thermodynamics (3 credits)
- MET 271 Machine Design (3 credits)
- MET 276 Engineering Seminar (3 credits)
- Humanities Elective (3 credits)
Additional General Education Requirements
- ELECTIVE General Education Elective (3 credits)
Total Credits 73
MODEL SCHEDULE FOR MECHANICAL ENGINEERING TECHNOLOGY (OPTION #2)
Semester 1
- MET 101 Drafting Fundamentals (3 credits)
- MET 106 Engineering Graphics (3 credits)
- MET 116 Computer-Aided Drafting (3 credits)
- MET 176 Manufacturing Processes (3 credits)
- MATH 207 Pre-Calculus (or higher) (4 credits)
- ENG 106 English Composition (3 credits)
Semester 2
- MET 111 Engineering Standards (3 credits)
- MET 161 Fabrication Principles (3 credits)
- MET 166 Mechanical Design (3 credits)
- MET 171 Product Design (3 credits)
- PHYS 113 Statics (3 credits)
Semester 3
- MET 201 Engineering Mechanics (3 credits)
- MET 206 Fluid Mechanics (3 credits)
- MET 211 Production Design (3 credits)
- MET 216 Parametric Solid Modeling (3 credits)
- ENG 216 Technical Writing (3 credits)
- PHYS 213 General Physics I (4 credits)
Semester 4
- MET 261 Engineering Materials (3 credits)
- MET 266 Thermodynamics (3 credits)
- MET 271 Machine Design (3 credits)
- MET 276 Engineering Seminar (3 credits)
- Humanities Elective (3 credits)
Additional General Education Requirements
- ELECTIVE(S) General Studies Elective(s) (5 credits)
Total Credits 73
Faculty
Occupational Advisory Committee
The Occupational Advisory Committee (OAC) serves as a vital link between the Program of study and industry, ensuring that the program remains aligned with current workforce needs, technological advancements, and best practices in the field. Composed of employers, educators, and other community members, the committee provides guidance, feedback, and recommendations to enhance the curriculum, instructional methods, and student learning experiences.
Purpose and Responsibilities:
- Curriculum & Industry Alignment
- Workforce Readiness
- Student & Faculty Support
- Internship & Employment Connections
- Accreditation & Program Evaluation
- Facilities & Equipment Recommendations
By fostering a strong relationship between academia and industry, the OAC helps ensure that Thaddeus Stevens College programs maintain the highest standards in CTE (career and technical education).
- Paul Feight, Spanco and Rigid Lifelines
Edward Garrity, Honeywell - Bernard Hershberger, Stoltz Mfg., LLC
- Ken Keim, Phoenix Contact Inc.
- Jason Myer, RV industries
- David Sarraf, TE Connectivity
- Shane Seace, Molex
- Laura Schoonover, Actalent
- Becca Trout, RG Group
Essential Skills Learned
Tasks
- Read dials and meters to determine amperage, voltage, electrical output, and input at a specific operating temperature to analyze parts performance.
- Analyze test results in relation to design or rated specifications and test objectives, and modify or adjust equipment to meet specifications.
- Evaluate tool drawing designs by measuring drawing dimensions and comparing them with original specifications for form and function using engineering skills.
- Devise, fabricate, and assemble new or modified mechanical components for products such as industrial machinery or equipment, and measuring instruments.
- Discuss changes in design, method of manufacture and assembly, and drafting techniques and procedures with staff and coordinate corrections.
- Operate drill press, grinders, engine lathe, or other machines to modify parts tested or to fabricate experimental parts for testing.
- Review project instructions and blueprints to ascertain test specifications, procedures, and objectives, and test the nature of technical problems such as redesign.
- Set up and conduct tests of complete units and components under operational conditions to investigate proposals for improving equipment performance.
- Review project instructions and specifications to identify, modify, and plan requirements fabrication, assembly, and testing.
- Record test procedures and results, numerical and graphical data, and recommendations for changes in product or test methods.
Tools used in this occupation
- Gas welding or brazing or cutting apparatus — Brazing equipment; Gas welding equipment; Oxyacetylene welding equipment; Stick welding machines
- Gauges or inspection fixtures — Bore gauges; Dial indicators; Ring gauges; Taper plug gauges
- Milling cutters — Combination milling machines; Computerized numerical control CNC vertical milling machines; Sheet metal slitters; Track burning machines
- Power grinders — Cylindrical grinders; Pedestal grinders; Surface grinders
- Screwdrivers — Offset screwdrivers; Phillips head screwdrivers; Slotted screwdrivers; Straight screwdrivers
Technology used in this occupation
- Analytical or scientific software — MSC Software Adams; Spectral Dynamics STARAcoustics; The MathWorks MATLAB; Wolfram Research Mathematica
- Computer-aided design CAD software — Autodesk AutoCAD Mechanical; Bentley MicroStation; IBM CATIA V5; SolidWorks CAD software
- Computer-aided manufacturing CAM software — CNC Mastercam; Three-dimensional 3D solid modeling software
- Development environment software — Microsoft Visual Basic; National Instruments LabVIEW
- Industrial control software — Computerized numerical control CNC programming software; Robotic control software; Soft Servo Systems LadderWorks PLC
Knowledge
- Mechanical — Knowledge of machines and tools, including their designs, uses, repair, and maintenance.
- Engineering and Technology — Knowledge of the practical application of engineering science and technology. This includes applying principles, techniques, procedures, and equipment to the design and production of various goods and services.
- Design — Knowledge of design techniques, tools, and principles involved in the production of precision technical plans, blueprints, drawings, and models.
- Mathematics — Knowledge of arithmetic, algebra, geometry, calculus, statistics, and their applications.
- Production and Processing — Knowledge of raw materials, production processes, quality control, costs, and other techniques for maximizing the effective manufacture and distribution of goods.
- English Language — Knowledge of the structure and content of the English language including the meaning and spelling of words, rules of composition, and grammar.
- Computers and Electronics — Knowledge of circuit boards, processors, chips, electronic equipment, and computer hardware and software, including applications and programming.
- Physics — Knowledge, and prediction of physical principles, laws, their interrelationships, and applications to understanding fluid, material, and atmospheric dynamics, and mechanical, electrical, atomic, and subatomic structures and processes.
Skills
- Active Listening — Giving full attention to what other people are saying, taking time to understand the points being made, asking questions as appropriate, and not interrupting at inappropriate times.
- Reading Comprehension — Understanding written sentences and paragraphs in work-related documents.
- Critical Thinking — Using logic and reasoning to identify the strengths and weaknesses of alternative solutions, conclusions, or approaches to problems.
- Operation Monitoring — Watching gauges, dials, or other indicators to make sure a machine is working properly.
- Speaking — Talking to others to convey information effectively.
- Complex Problem Solving — Identifying complex problems and reviewing related information to develop and evaluate options and implement solutions.
- Judgment and Decision Making — Considering the relative costs and benefits of potential actions to choose the most appropriate one.
- Monitoring — Monitoring/Assessing performance of yourself, other individuals, or organizations to make improvements or take corrective action.
- Quality Control Analysis — Conducting tests and inspections of products, services, or processes to evaluate quality or performance.
- Writing — Communicating effectively in writing as appropriate for the needs of the audience.
Abilities
- Oral Comprehension — The ability to listen to and understand information and ideas presented through spoken words and sentences.
- Deductive Reasoning — The ability to apply general rules to specific problems to produce answers that make sense.
- Problem Sensitivity — The ability to tell when something is wrong or is likely to go wrong. It does not involve solving the problem, only recognizing there is a problem.
- Near Vision — The ability to see details at close range (within a few feet of the observer).
- Oral Expression — The ability to communicate information and ideas in speaking so others will understand.
- Written Comprehension — The ability to read and understand information and ideas presented in writing.
- Inductive Reasoning — The ability to combine pieces of information to form general rules or conclusions (includes finding a relationship among seemingly unrelated events).
- Information Ordering — The ability to arrange things or actions in a certain order or pattern according to a specific rule or set of rules (e.g., patterns of numbers, letters, words, pictures, mathematical operations).
- Category Flexibility — The ability to generate or use different sets of rules for combining or grouping things in different ways.
- Control Precision — The ability to quickly and repeatedly adjust the controls of a machine or a vehicle to exact positions.
Work Activities
- Getting Information — Observing, receiving, and otherwise obtaining information from all relevant sources.
- Identifying Objects, Actions, and Events — Identifying information by categorizing, estimating, recognizing differences or similarities, and detecting changes in circumstances or events.
- Inspecting Equipment, Structures, or Material — Inspecting equipment, structures, or materials to identify the cause of errors or other problems or defects.
- Making Decisions and Solving Problems — Analyzing information and evaluating results to choose the best solution and solve problems.
- Evaluating Information to Determine Compliance with Standards — Using relevant information and individual judgment to determine whether events or processes comply with laws, regulations, or standards.
- Monitor Processes, Materials, or Surroundings — Monitoring and reviewing information from materials, events, or the environment, to detect or assess problems.
- Communicating with Supervisors, Peers, or Subordinates — Providing information to supervisors, co-workers, and subordinates by telephone, in written form, e-mail, or in person.
- Documenting/Recording Information — Entering, transcribing, recording, storing, or maintaining information in written or electronic/magnetic form.
- Controlling Machines and Processes — Using either control mechanisms or direct physical activity to operate machines or processes (not including computers or vehicles).
- Interacting With Computers — Using computers and computer systems (including hardware and software) to program, write software, set up functions, enter data, or process information.
Work Context
- Face-to-Face Discussions — How often do you have to have face-to-face discussions with individuals or teams in this job?
- Freedom to Make Decisions — How much decision-making freedom, without supervision, does the job offer?
- Indoors, Environmentally Controlled — How often does this job require working indoors in environmentally controlled conditions?
- Contact With Others — How much does this job require the worker to be in contact with others (face-to-face, by telephone, or otherwise) in order to perform it?
- Importance of Being Exact or Accurate — How important is being very exact or highly accurate in performing this job?
- Structured versus Unstructured Work — To what extent is this job structured for the worker, rather than allowing the worker to determine tasks, priorities, and goals?
- Electronic Mail — How often do you use electronic mail in this job?
- Work With Work Group or Team — How important is it to work with others in a group or team in this job?
- Duration of Typical Work Week — Number of hours typically worked in one week.
- Wear Common Protective or Safety Equipment such as Safety Shoes, Glasses, Gloves, Hearing Protection, Hard Hats, or Life Jackets — How much does this job require wearing common protective or safety equipment such as safety shoes, glasses, gloves, hard hats, or life jackets?
Interests
- Realistic — Realistic occupations frequently involve work activities that include practical, hands-on problems, and solutions. They often deal with plants, animals, and real-world materials like wood, tools, and machinery. Many of the occupations require working outside and do not involve a lot of paperwork or working closely with others.
- Investigative — Investigative occupations frequently involve working with ideas and require an extensive amount of thinking. These occupations can involve searching for facts and figuring out problems mentally.
Work Styles
- Dependability — Job requires being reliable, responsible, and dependable, and fulfilling obligations.
- Attention to Detail — Job requires being careful about detail and thorough in completing work tasks.
- Cooperation — Job requires being pleasant with others on the job and displaying a good-natured, cooperative attitude.
- Adaptability/Flexibility — Job requires being open to change (positive or negative) and to considerable variety in the workplace.
- Analytical Thinking — Job requires analyzing information and using logic to address work-related issues and problems.
- Stress Tolerance — Job requires accepting criticism and dealing calmly and effectively with high-stress situations.
- Initiative — Job requires a willingness to take on responsibilities and challenges.
- Integrity — Job requires being honest and ethical.
- Independence — Job requires developing one’s own ways of doing things, guiding oneself with little or no supervision, and depending on oneself to get things done.
- Persistence — Job requires persistence in the face of obstacles.
Work Values
- Support — Occupations that satisfy this work value offer supportive management that stands behind employees. Corresponding needs are Company Policies, Supervision: Human Relations, and Supervision: Technical.
- Working Conditions — Occupations that satisfy this work value offer job security and good working conditions. Corresponding needs are Activity, Compensation, Independence, Security, Variety, and Working Conditions.
- Relationships — Occupations that satisfy this work value allow employees to provide service to others and work with co-workers in a friendly non-competitive environment. Corresponding needs are Co-workers, Moral Values, and Social Service.
Performance Measures
Internal Key Performance Indicators (Sources: Internal data collections, and Post-Graduate Surveys)
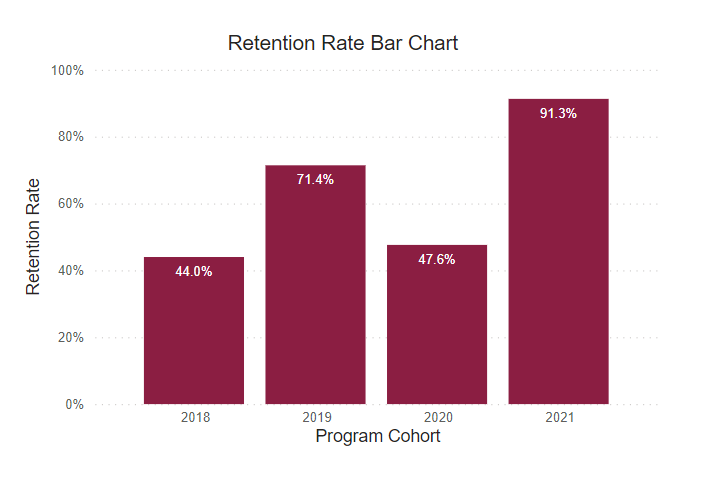
Retention Rate
This rate reflects the continuous term-to-term persistence rate for certificate programs and the fall-to-fall retention rate for associate degree programs.
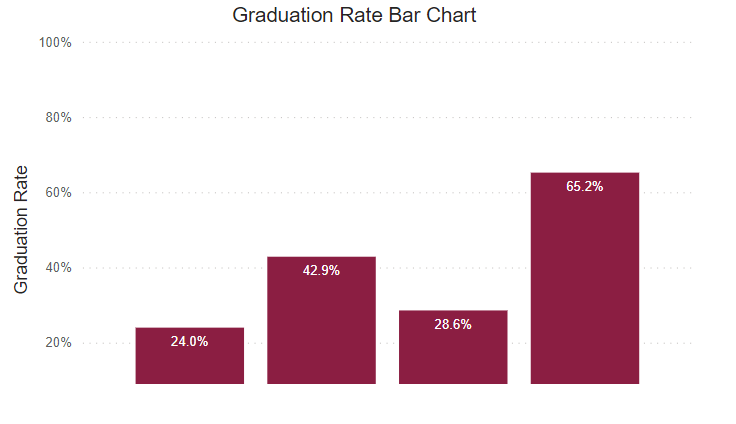
Graduation Rate
This rate reflects the number of freshmen who were officially enrolled in the fall semester and earned a certificate or degree within the expected timeframe.
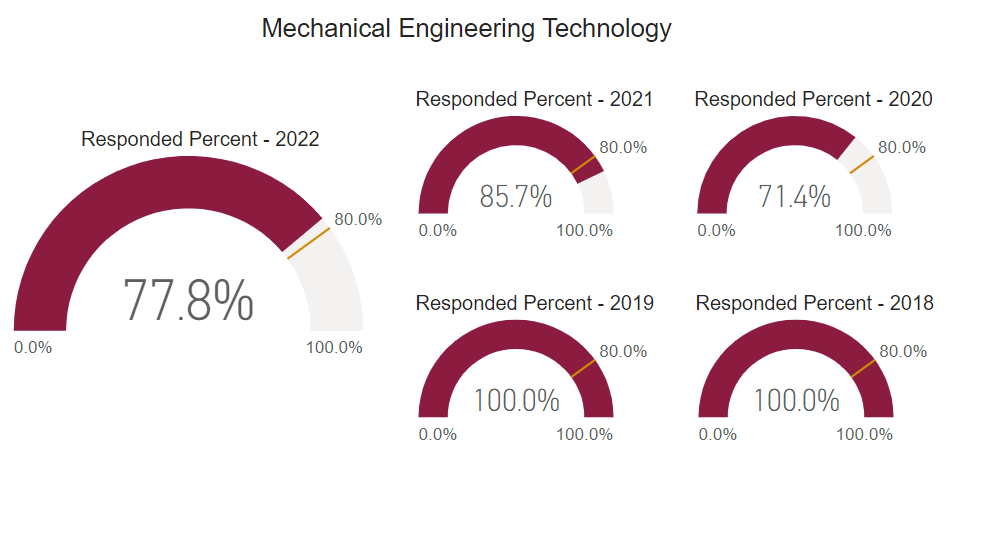
Post Graduate Survey Response Rate
The post graduate survey is an annual on-line post graduate survey utilized by the college to gather vital information regarding career placement, starting salary, and level of satisfaction.
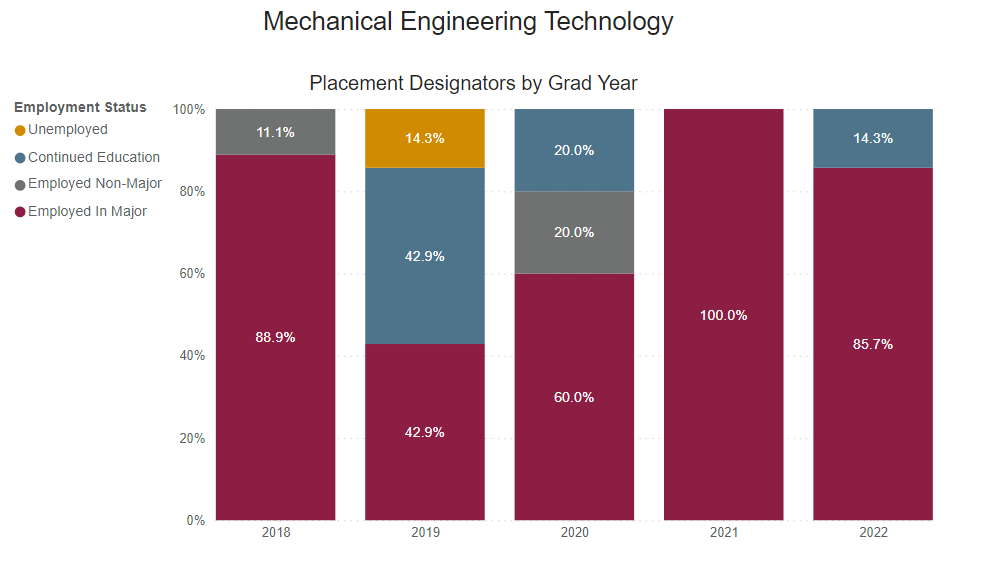
Employed Full Time Outside of Major
Percentage of graduates who reported being employed full-time outside their field of study.
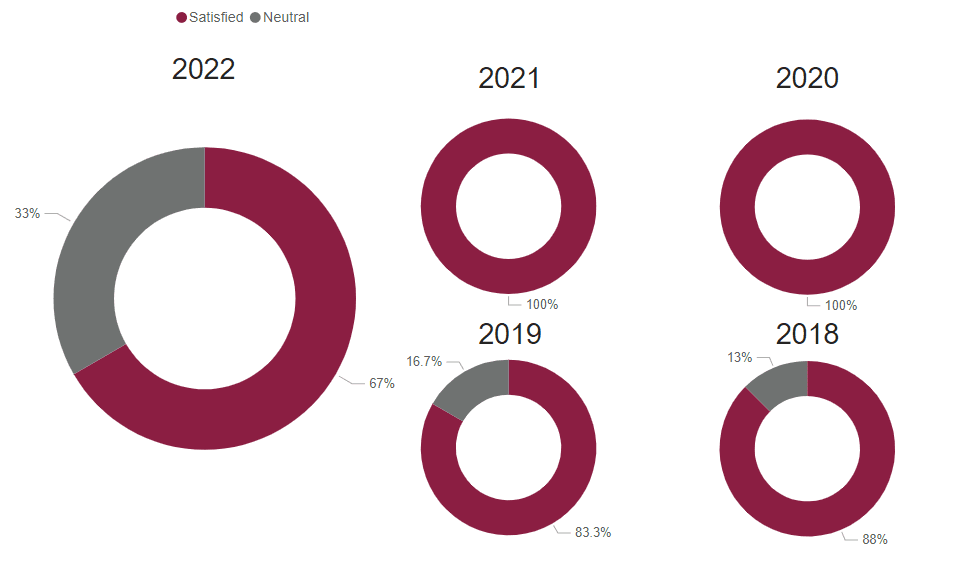
Graduate Satisfaction
This is the median graduate survey response evaluating the level of preparation for workforce entry (based on a 5-Item Likert Scale).
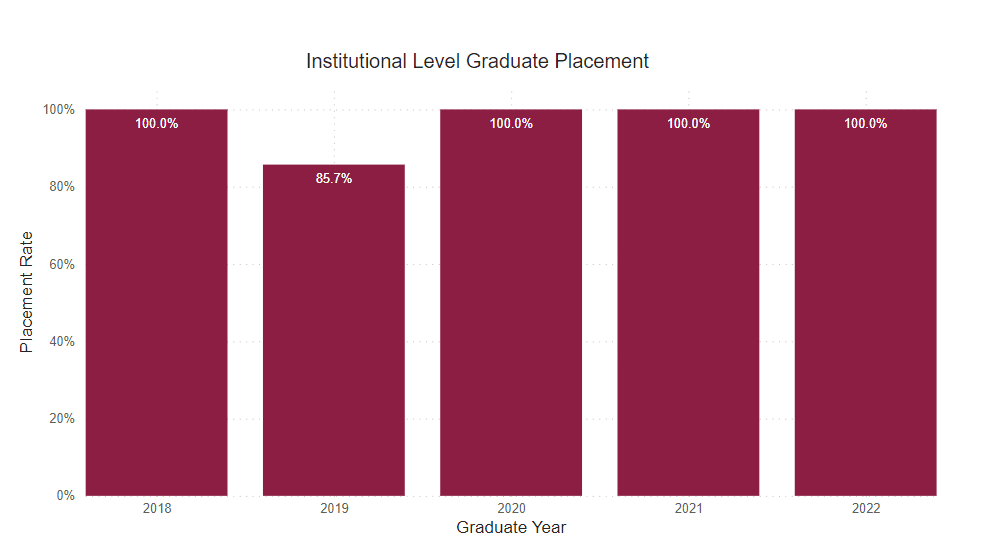
Placement Rate
This is the percent of graduate survey respondents who reported being employed or continued their education on a full-time basis.
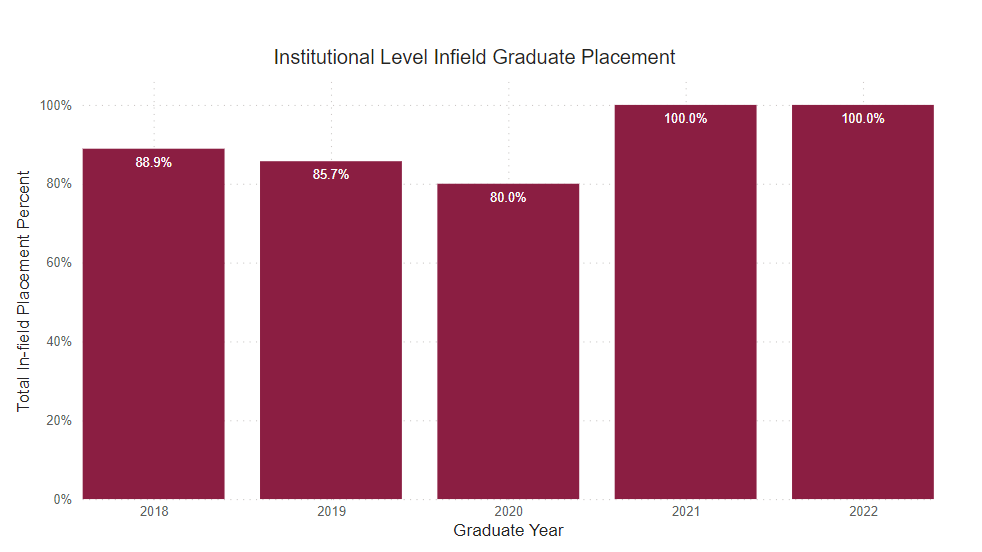
Employed Full Time Within Major
Percentage of graduates who reported being employed full-time within their field of study.

Annual Median Starting Salary
This number is based on the graduate survey response to the request to identify a starting salary from a range of options. This graph shows the median first-year annual salary. All calculations are based on the respondent’s self-reported first-year annual income.
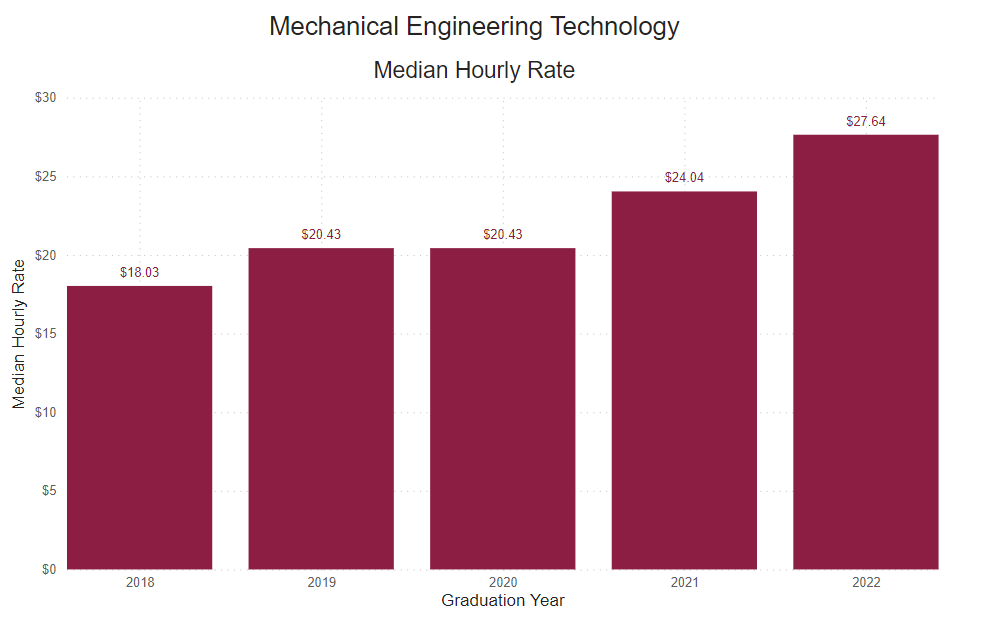
Reported Hourly Rate
This number is determined by dividing the reported median salary by the number of hours in a traditional full-time work week (40), then the number of weeks in a year (52).

Our graduates work with the industry’s best