Metals Fabrication & Welding Technology
Get started today
About Metals Fabrication & Welding Technology
The Metals Fabrication and Welding Technology program provides students with a working knowledge of the various tools, equipment and modern techniques used in the metals fabrication, mechanical installation and welding industries. The proper application of various layout, fabrication and assembly techniques for specific designs in sheet metal, plate, structural metals and pipe will be stressed. Students will design, estimate, fabricate and install projects relative to air handling systems, structural and miscellaneous fabricated systems. Proper and safe work habits must be developed due to the nature of the equipment necessary to be successful in the industry.
The understanding and mastery of layout techniques is an essential component for success in the Metals Fabrication and Welding fields. Therefore, disciplines in the basic, parallel line, radial line and triangulation methods of layout are covered. Also, instruction in blueprint reading relative to the manufacturing and construction industries will be required. Included are components in drafting, orthographic projection and symbol interpretation. Gas metal arc, shielded metal arc, gas tungsten arc, oxy-acetylene and flux core arc welding will be studied and practiced to allow students to obtain skills for a total understanding of fabricated projects from design through the final assembly processes.
Graduates of the Metals Fabrication and Welding Technology program are prepared to work in businesses and industries that design, build and install products that have been fabricated from sheet, plate and structural metals. Areas of employment include:
- H.V.A.C. Sheetmetal Duct Systems Fabrication and Installation
- Precision Sheetmetal Layout and Fabrication
- Welding
- Industrial Maintenance/Millwright
- Plate Layout/Fitter for Industrial Fabrication
- Mechanical Systems Estimator/Project Manager
- Fabrication Machinery Operator
- Equipment Manufacturing and Installation
- Structural Steel and Miscellaneous Iron Fabrication
- Automated Cutting Systems Operation Programming
- Sales – Industrial Equipment or Contractor
- Shop/Installation Foreman
- Fabrication of sanitary stainless steel products
- Food and Pharmaceutical processing applications
- Industrial Ventilation Fabrication and Installation
What you’ll learn
- Demonstrate the ability to perform technical work related to welding, structural steel fabrication, sheet metal and plate fabrication, applying OSHA and other applicable safety standards to work safely.
- Apply concepts of geometry, trigonometry and physics to develop, layout, fit and weld various fittings, structures and systems associated with industrial and commercial metals fabrication.
- Identify and demonstrate correct use of various hand and power tools used in the fabrication industry.
- Demonstrate the ability to develop and interpret blueprints using accepted practices of orthographic projection.
- Determine set-up effectiveness of shop equipment and develop methods of manufacturing various products.
- Keep accurate records of project work, time expended, materials used and costs incurred associated with a given job.
- Demonstrate a comprehension of business practices related to the metals fabrication industry.
- Estimate the costs associated with the design, fabrication and installation of various structural, sheet metal or maintenance projects.
- Demonstrate basic oral communication skills, speak logically and use various types of oral and written communication techniques to promote good business relationships, to develop leadership, and to establish good employer, customer and employee relationships.
- Demonstrate competency in the simple, parallel line, radial line and triangulation methods of layout to develop elbows, transitions, and tees in both round and rectangular forms.
- Understand industry standards of quality.
- Demonstrate the ability to choose the proper materials, fabrication and welding procedures for given projects.
- Be prepared to accept the challenges and responsibilities of the metals fabrication industry, knowing the full range of employment and advancement possibilities.
Sample Job Titles
Fabricate, assemble, install, and repair sheet metal products and equipment, such as ducts, control boxes, drainpipes, and furnace casings. Work may involve any of the following: setting up and operating fabricating machines to cut, bend, and straighten sheet metal; shaping metal over anvils, blocks, or forms using hammer; operating soldering and welding equipment to join sheet metal parts; or inspecting, assembling, and smoothing seams and joints of burred surfaces. Includes sheet metal duct installers who install prefabricated sheet metal ducts used for heating, air conditioning, or other purposes.
Career Opportunities
Graduates of the Metals Fabrication and Welding Technology program are prepared to work in businesses and industries that design, build, and install products that have been fabricated from sheet, plate, and structural metals. Areas of employment include:
- H.V.A.C. Sheetmetal Duct Systems Fabrication and Installation
- Precision Sheetmetal Layout and Fabrication
- Welding
- Industrial Maintenance/Millwright
- Plate Layout/Fitter for Industrial Fabrication
- Mechanical Systems Estimator/Project Manager
- Fabrication Machinery Operator
- Equipment Manufacturing and Installation
- Structural Steel and Miscellaneous Iron Fabrication
- Automated Cutting Systems Operation Programming
- Sales – Industrial Equipment or Contractor
- Shop/Installation Foreman
- Fabrication of sanitary stainless steel products
- Food and Pharmaceutical processing applications
- Industrial Ventilation Fabrication and Installation
Soar Agreements
This program enables students to apply certain credits earned in high school to the credits needed for a degree or certificate through Thaddeus Stevens College. The Metals Fabrication & Welding Technology degree qualifies for this program – see our SOAR program page for details!
Quick facts
Location
Greiner Advanced Manufacturing Center, North Building
Type of program
Associate Degree
Job/Salary Outlook
See industry data
Length of program
2 years, 73 credits
Cost of program
$4,500/semester tuition
$3,000 – $3,500/semester housing
$1,850 – $2,335/semester meal plan
Tool List (PDF)

The outcomes speak for themselves
Gas metal arc, shielded metal arc, gas tungsten arc, oxy-acetylene and flux core arc welding will be studied and practiced to allow students to obtain skills for a total understanding of fabricated projects from design through the final assembly processes.
96%
employment
$50K
med. salary
People of TSCT
Success stories

Program details
Courses
MODEL SCHEDULE FOR METALS FABRICATION & WELDING TECHNOLOGY
Semester 1
- MFWT 106 Gas Metal Arc Welding/Plasma Arc Cutting (3 credits)
- MFWT 111 Metals Fab I – Intro to Hand & Machine Processes (3 credits)
- MFWT 121 HVAC Duct Design and Fabrication (3 credits)
- MFWT 126 Drafting Fundamentals (3 credits)
- MATH 137 Intermediate Algebra (3 credits) (or higher)
- CIS 105 Drawing with AutoCAD (3 credits)
Semester 2
- MFWT 154 Flux Corded Arc Welding/Oxy-Acetylene Cutting and Welding (4 credits)
- MFWT 162 Metals Fabrication II – Parallel Line
- Development Machine Processes (4 credits)
- MFWT 167 Metals Fabrication II – Parallel Line
- Development Machine Processes (2 credits)
- MFWT 171 Materials of the Trade/Applied Metallurgy (2 credits)
- MATH 132 Elementary Geometry (3 credits) (or higher)
- CIS 111 Intro to Computer Applications (3 credits)
Semester 3
- MFWT 207 Shielded Metal Arc Welding (4 credits)
- MFWT 212 Metals Fabrication III – Triangulation
- Pattern Machine Processes (4 credits)
- MFWT 222 CNC Applications and Estimating (4 credits)
- Physics Elective 101, 106, 113, or 213 (3 credits)
- ENG 106 Composition (3 credits)
Semester 4
- MFWT 257 Gas Tungsten Arc Welding (4 credits)
- MFWT 262 Metals Fabrication IV Radial Design Development & Machine Processes (4 credits)
- MFWT 267 Industrial Apps III – Print Reading for Welding (4 credits)
- ENG 216 Technical Writing (3 credits)
- ELECTIVE Humanities Elective (3 credits)
Additional General Education Requirements
- Health Elective 106 or 111 (1 credit)
Total Credits 73
Faculty
Occupational Advisory Committee
The Occupational Advisory Committee (OAC) serves as a vital link between the Program of study and industry, ensuring that the program remains aligned with current workforce needs, technological advancements, and best practices in the field. Composed of employers, educators, and other community members, the committee provides guidance, feedback, and recommendations to enhance the curriculum, instructional methods, and student learning experiences.
Purpose and Responsibilities:
- Curriculum & Industry Alignment
- Workforce Readiness
- Student & Faculty Support
- Internship & Employment Connections
- Accreditation & Program Evaluation
- Facilities & Equipment Recommendations
By fostering a strong relationship between academia and industry, the OAC helps ensure that Thaddeus Stevens College programs maintain the highest standards in CTE (career and technical education).
- Yolanda Anderson, Ladder Tower
- Scott Dolor, M. Davis & Sons
- Greg Esh, Goodhart Sons Inc
- Daniel Feeser, Johnson Controls Navy Systems
- John Forwood, SWF Industrial
- Joyce Hostetler, Greiner Industries Inc
- Cameron Leakey, Goodhart Sons Inc
- Melissa Martin, Viocity Group
- Perry Patton, Walton & Company
- John Peiffer, High Industries
- Sasa Randjelovic, JGM Fabricators & Constructors, LLC
- Daniel Rice, PBZ Manufacturing
- Joseph Ruble, Miller/ITW
- Sasha Wawrzyniak, Viocity Group
- Gregory Weitzel, High Steel Structures LLC
- Eddie Woodward, ITW/Miller Electric
Essential Skills Learned
Tasks
- Determine project requirements, including scope, assembly sequences, and required methods and materials, according to blueprints, drawings, and written or verbal instructions.
- Layout, measure, and mark dimensions and reference lines on material, such as roofing panels, according to drawings or templates, using calculators, scribes, dividers, squares, and rulers.
- Fasten seams or joints together with welds, bolts, cement, rivets, solder, caulks, metal drive clips, or bonds to assemble components into products or to repair sheet metal items.
- Install assemblies, such as flashing, pipes, tubes, heating and air conditioning ducts, furnace casings, rain gutters, or downspouts in supportive frameworks.
- Convert blueprints into shop drawings to be followed in the construction or assembly of sheet metal products.
- Fabricate or alter parts at construction sites, using shears, hammers, punches, or drills.
- Select gauges or types of sheet metal or nonmetallic material, according to product specifications.
- Maneuver completed units into position for installation, and anchor the units.
- Transport prefabricated parts to construction sites for assembly and installation.
- Drill and punch holes in metal, for screws, bolts, and rivets.
Tools used in this occupation
- Metal cutters — Aviation snips; Hand notchers; Power notchers; V-notchers
- Punches or nail sets or drifts — Center punches; Hole punches; Prick punches; Rotary punches
- Rivet tools — Dimplers; Pneumatic riveters; Pop rivet guns; Riveting tools
- Sequential forming machines — Bar folders; Beading machines; Spiral duct machines; Wiring machines
- Shears — Power shears; Ring and circular shears; Squaring shears; Unishears
- Workshop presses — Cleat folders; Hand brakes; Power presses; Rivet presses
Technology used in this occupation
- Computer-aided design CAD software — Autodesk AutoCAD software; Parametric Technology Pro/ENGINEER software; UGS NX; XY Soft Sheet Cutting Suite
- Computer-aided manufacturing CAM software — Applied Production ProFab; JETCAM Expert; Striker Systems SS-Profile; WiCAM PN4000
- Database user interface and query software — Data entry software
- Spreadsheet software
Knowledge
- Mechanical — Knowledge of machines and tools, including their designs, uses, repair, and maintenance.
- Building and Construction — Knowledge of materials, methods, and the tools involved in the construction or repair of houses, buildings, or other structures such as highways and roads.
- Design — Knowledge of design techniques, tools, and principles involved in the production of precision technical plans, blueprints, drawings, and models.
- Mathematics — Knowledge of arithmetic, algebra, geometry, calculus, statistics, and their applications.
- Administration and Management — Knowledge of business and management principles involved in strategic planning, resource allocation, human resources modeling, leadership technique, production methods, and coordination of people and resources.
- Engineering and Technology — Knowledge of the practical application of engineering science and technology. This includes applying principles, techniques, procedures, and equipment to the design and production of various goods and services.
- Production and Processing — Knowledge of raw materials, production processes, quality control, costs, and other techniques for maximizing the effective manufacture and distribution of goods.
- English Language — Knowledge of the structure and content of the English language including the meaning and spelling of words, rules of composition, and grammar.
- Customer and Personal Service — Knowledge of principles and processes for providing customer and personal services. This includes customer needs assessment, meeting quality standards for services, and evaluation of customer satisfaction.
Skills
- Critical Thinking — Using logic and reasoning to identify the strengths and weaknesses of alternative solutions, conclusions, or approaches to problems.
- Judgment and Decision Making — Considering the relative costs and benefits of potential actions to choose the most appropriate one.
- Time Management — Managing one’s own time and the time of others.
- Mathematics — Using mathematics to solve problems.
- Active Listening — Giving full attention to what other people are saying, taking time to understand the points being made, asking questions as appropriate, and not interrupting at inappropriate times.
- Coordination — Adjusting actions in relation to others’ actions.
- Monitoring — Monitoring/Assessing performance of yourself, other individuals, or organizations to make improvements or take corrective action.
- Reading Comprehension — Understanding written sentences and paragraphs in work-related documents.
- Speaking — Talking to others to convey information effectively.
Abilities
- Near Vision — The ability to see details at close range (within a few feet of the observer).
- Information Ordering — The ability to arrange things or actions in a certain order or pattern according to a specific rule or set of rules (e.g., patterns of numbers, letters, words, pictures, mathematical operations).
- Visualization — The ability to imagine how something will look after it is moved around or when its parts are moved or rearranged.
- Multilimb Coordination — The ability to coordinate two or more limbs (for example, two arms, two legs, or one leg and one arm) while sitting, standing, or lying down. It does not involve performing the activities while the whole body is in motion.
- Selective Attention — The ability to concentrate on a task over a period of time without being distracted.
- Arm-Hand Steadiness — The ability to keep your hand and arm steady while moving your arm or while holding your arm and hand in one position.
- Control Precision — The ability to quickly and repeatedly adjust the controls of a machine or a vehicle to exact positions.
- Deductive Reasoning — The ability to apply general rules to specific problems to produce answers that make sense.
- Depth Perception — The ability to judge which of several objects is closer or farther away from you, or to judge the distance between you and an object.
- Flexibility of Closure — The ability to identify or detect a known pattern (a figure, object, word, or sound) that is hidden in other distracting material.
Work Activities
- Getting Information — Observing, receiving, and otherwise obtaining information from all relevant sources.
- Making Decisions and Solving Problems — Analyzing information and evaluating results to choose the best solution and solve problems.
- Handling and Moving Objects — Using hands and arms in handling, installing, positioning, and moving materials, and manipulating things.
- Communicating with Supervisors, Peers, or Subordinates — Providing information to supervisors, co-workers, and subordinates by telephone, in written form, e-mail, or in person.
- Controlling Machines and Processes — Using either control mechanisms or direct physical activity to operate machines or processes (not including computers or vehicles).
- Inspecting Equipment, Structures, or Material — Inspecting equipment, structures, or materials to identify the cause of errors or other problems or defects.
- Monitor Processes, Materials, or Surroundings — Monitoring and reviewing information from materials, events, or the environment, to detect or assess problems.
- Performing General Physical Activities — Performing physical activities that require considerable use of your arms and legs and moving your whole body, such as climbing, lifting, balancing, walking, stooping, and handling of materials.
- Identifying Objects, Actions, and Events — Identifying information by categorizing, estimating, recognizing differences or similarities, and detecting changes in circumstances or events.
- Operating Vehicles, Mechanized Devices, or Equipment — Running, maneuvering, navigating, or driving vehicles or mechanized equipment, such as forklifts, passenger vehicles, aircraft, or watercraft.
Work Context
- Sounds, Noise Levels Are Distracting or Uncomfortable — How often does this job require working exposed to sounds and noise levels that are distracting or uncomfortable?
- Exposed to Contaminants — How often does this job require working exposed to contaminants (such as pollutants, gases, dust, or odors)?
- Wear Common Protective or Safety Equipment such as Safety Shoes, Glasses, Gloves, Hearing Protection, Hard Hats, or Life Jackets — How much does this job require wearing common protective or safety equipment such as safety shoes, glasses, gloves, hard hats, or life jackets?
- Face-to-Face Discussions — How often do you have to have face-to-face discussions with individuals or teams in this job?
- Contact With Others — How much does this job require the worker to be in contact with others (face-to-face, by telephone, or otherwise) in order to perform it?
- Importance of Being Exact or Accurate — How important is being very exact or highly accurate in performing this job?
- Structured versus Unstructured Work — To what extent is this job structured for the worker, rather than allowing the worker to determine tasks, priorities, and goals?
- Telephone — How often do you have telephone conversations in this job?
- Exposed to Minor Burns, Cuts, Bites, or Stings — How often does this job require exposure to minor burns, cuts, bites, or stings?
- Indoors, Not Environmentally Controlled — How often does this job require working indoors in non-controlled environmental conditions (e.g., warehouse without heat)?
Interests
- Realistic — Realistic occupations frequently involve work activities that include practical, hands-on problems, and solutions. They often deal with plants, animals, and real-world materials like wood, tools, and machinery. Many of the occupations require working outside and do not involve a lot of paperwork or working closely with others.
Work Styles
- Attention to Detail — Job requires being careful about detail and thorough in completing work tasks.
- Dependability — Job requires being reliable, responsible, and dependable, and fulfilling obligations.
- Cooperation — Job requires being pleasant with others on the job and displaying a good-natured, cooperative attitude.
- Self-Control — Job requires maintaining composure, keeping emotions in check, controlling anger, and avoiding aggressive behavior, even in very difficult situations.
- Initiative — Job requires a willingness to take on responsibilities and challenges.
- Adaptability/Flexibility — Job requires being open to change (positive or negative) and to considerable variety in the workplace.
- Independence — Job requires developing one’s own ways of doing things, guiding oneself with little or no supervision, and depending on oneself to get things done.
- Integrity — Job requires being honest and ethical.
- Achievement/Effort — Job requires establishing and maintaining personally challenging achievement goals and exerting effort toward mastering tasks.
- Analytical Thinking — Job requires analyzing information and using logic to address work-related issues and problems.
Work Values
- Support — Occupations that satisfy this work value offer supportive management that stands behind employees. Corresponding needs are Company Policies, Supervision: Human Relations, and Supervision: Technical.
- Independence — Occupations that satisfy this work value allow employees to work on their own and make decisions. Corresponding needs are Creativity, Responsibility, and Autonomy.
- Relationships — Occupations that satisfy this work value allow employees to provide service to others and work with co-workers in a friendly non-competitive environment. Corresponding needs are Co-workers, Moral Values, and Social Service.
Performance Measures
Internal Key Performance Indicators (Sources: Internal data collections, and Post-Graduate Surveys)
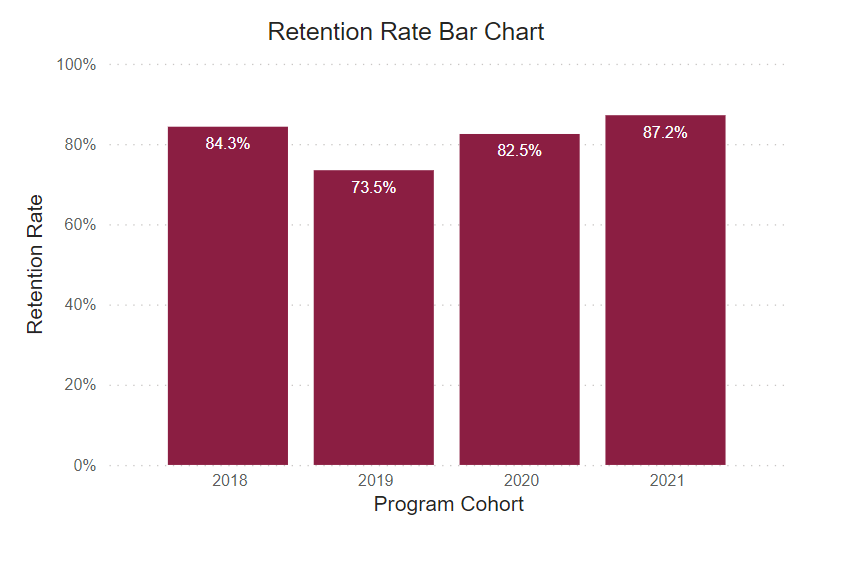
Retention Rate
This rate reflects the continuous term-to-term persistence rate for certificate programs and the fall-to-fall retention rate for associate degree programs.
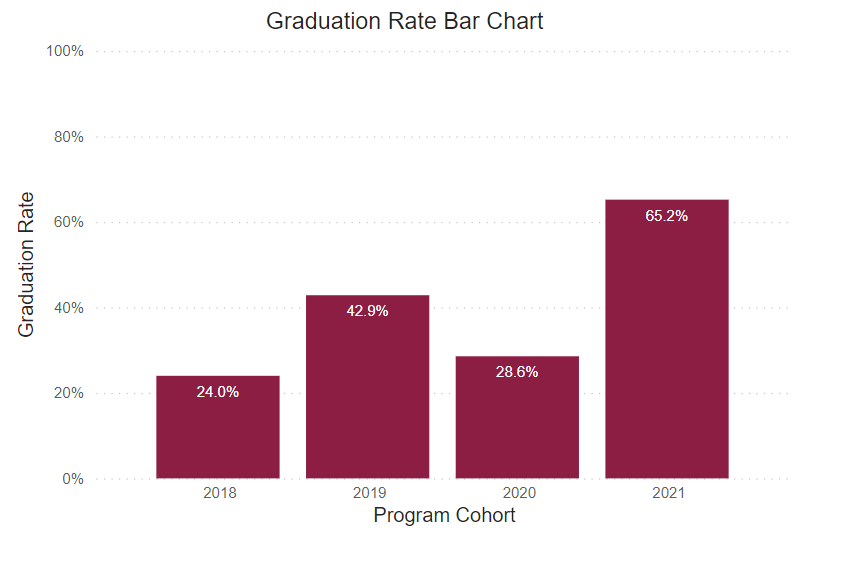
Graduation Rate
This rate reflects the number of freshmen who were officially enrolled in the fall semester and earned a certificate or degree within the expected timeframe.
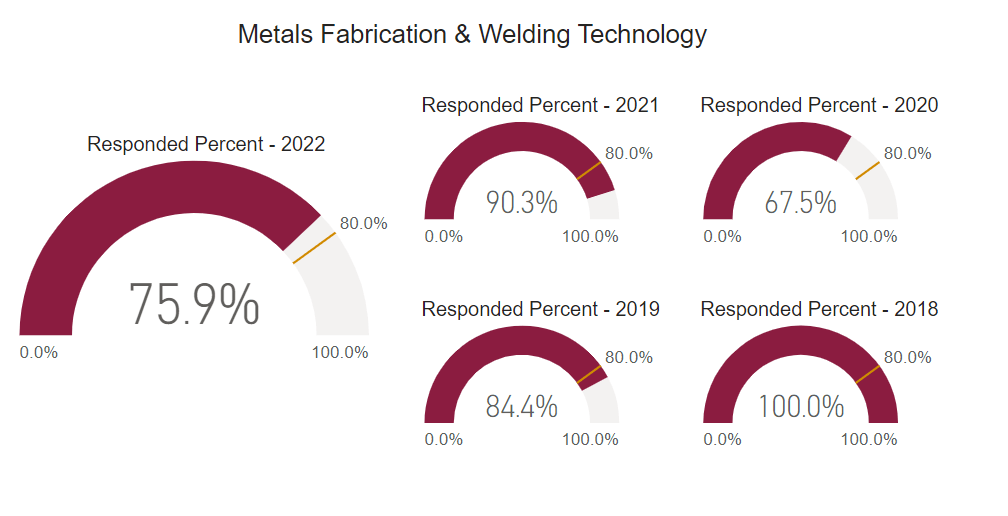
Post Graduate Survey Response Rate
The post graduate survey is an annual on-line post graduate survey utilized by the college to gather vital information regarding career placement, starting salary, and level of satisfaction.
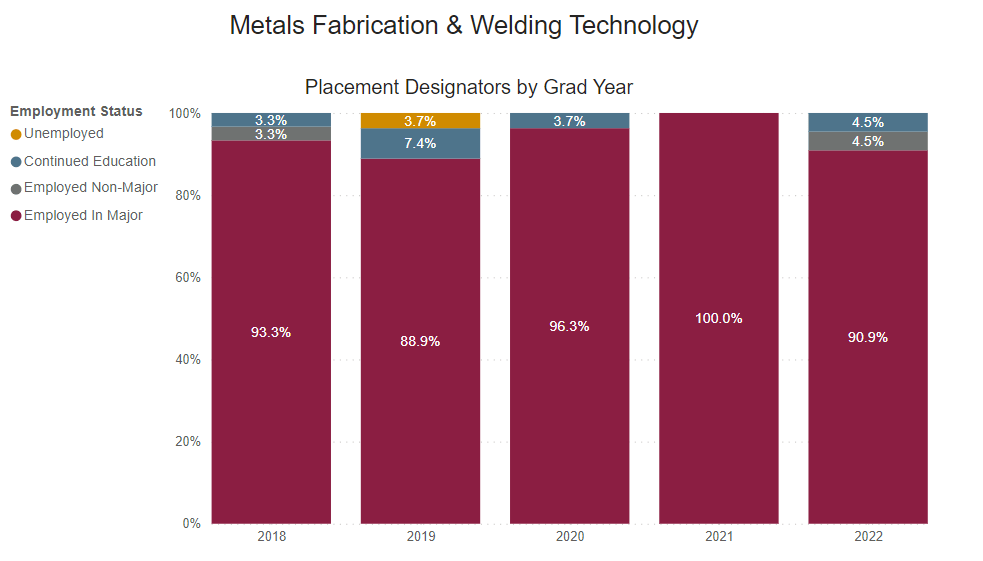
Employed Full Time Outside of Major
Percentage of graduates who reported being employed full-time outside their field of study.
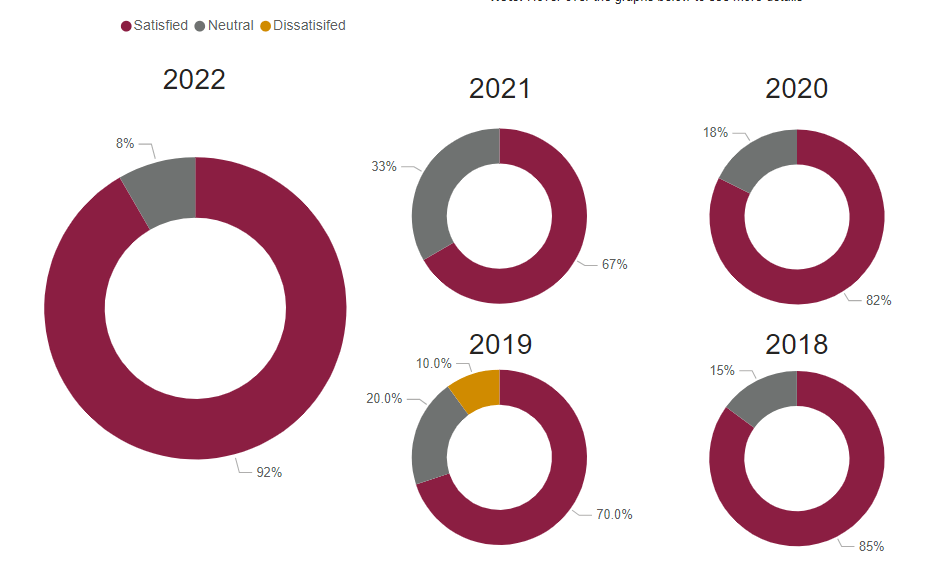
Graduate Satisfaction
This is the median graduate survey response evaluating the level of preparation for workforce entry (based on a 5-Item Likert Scale).
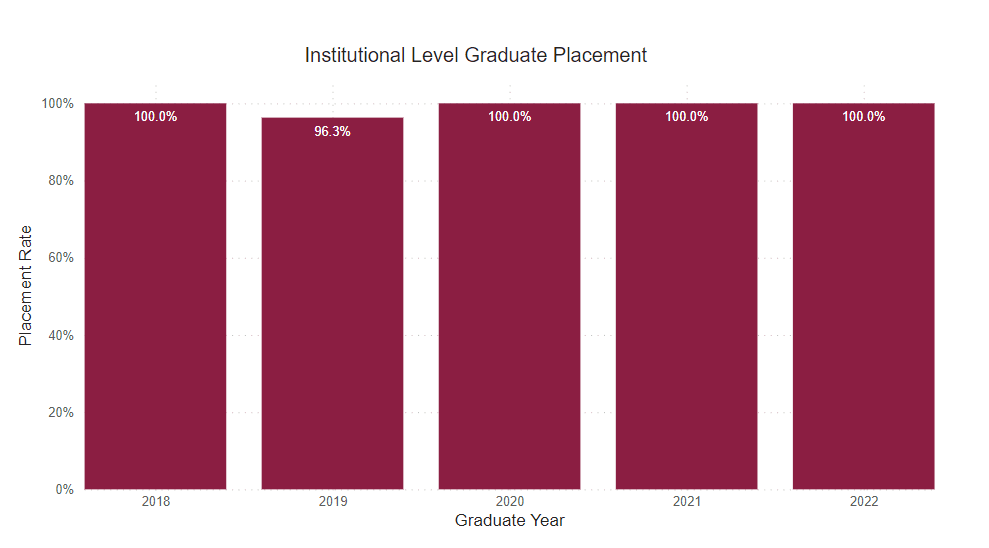
Placement Rate
This is the percent of graduate survey respondents who reported being employed or continued their education on a full-time basis.
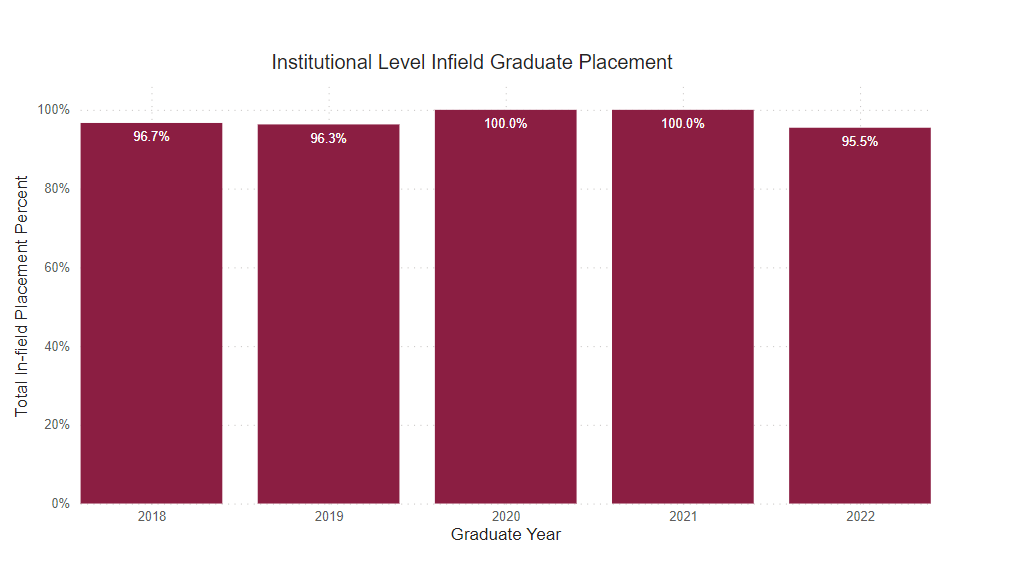
Employed Full Time Within Major
Percentage of graduates who reported being employed full-time within their field of study.
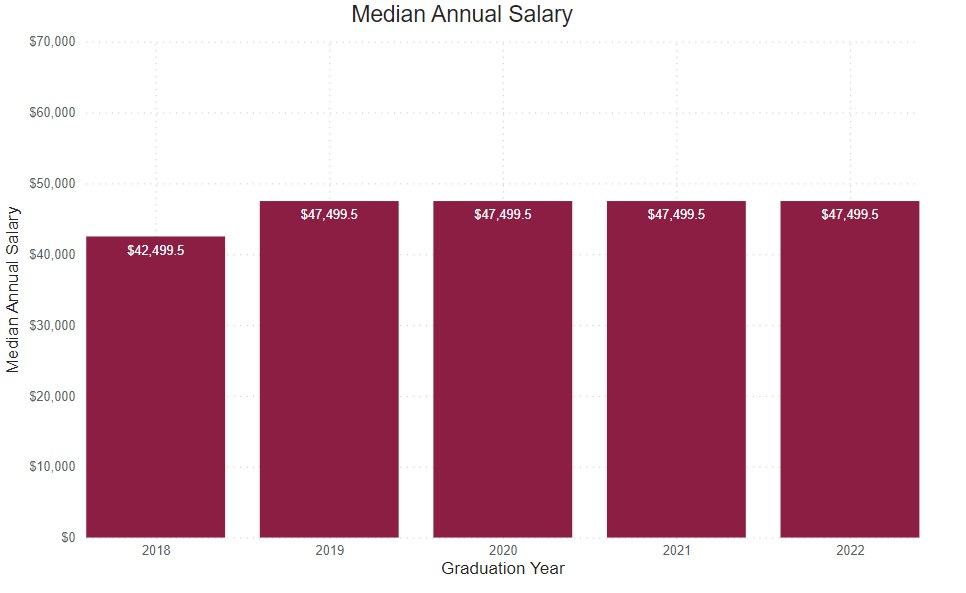
Annual Median Starting Salary
This number is based on the graduate survey response to the request to identify a starting salary from a range of options. This graph shows the median first-year annual salary. All calculations are based on the respondent’s self-reported first-year annual income.
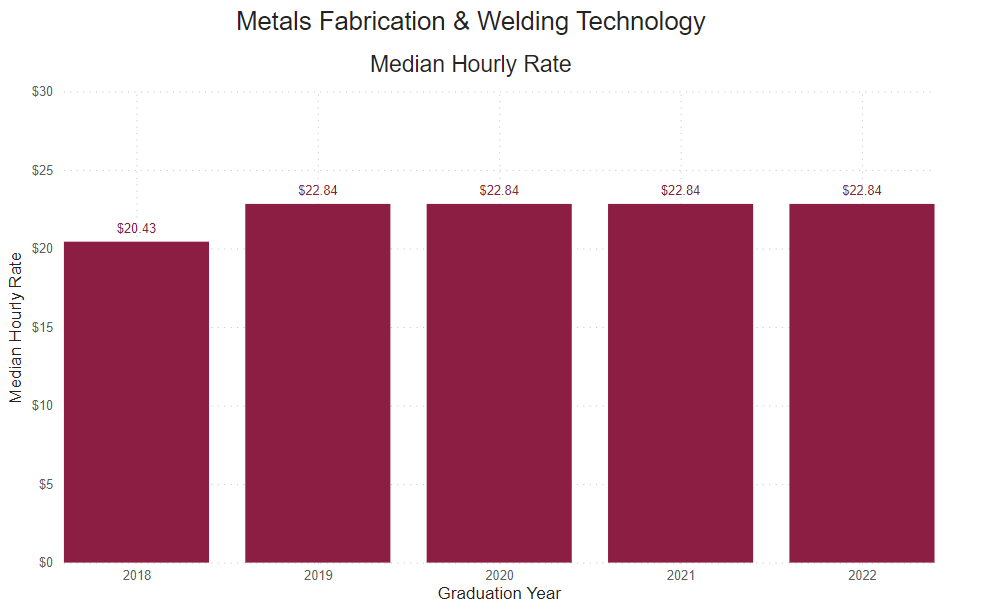
Reported Hourly Rate
This number is determined by dividing the reported median salary by the number of hours in a traditional full-time work week (40), then the number of weeks in a year (52).

Our graduates work with the industry’s best