Plumbing Technology
Get started today
About Plumbing Technology
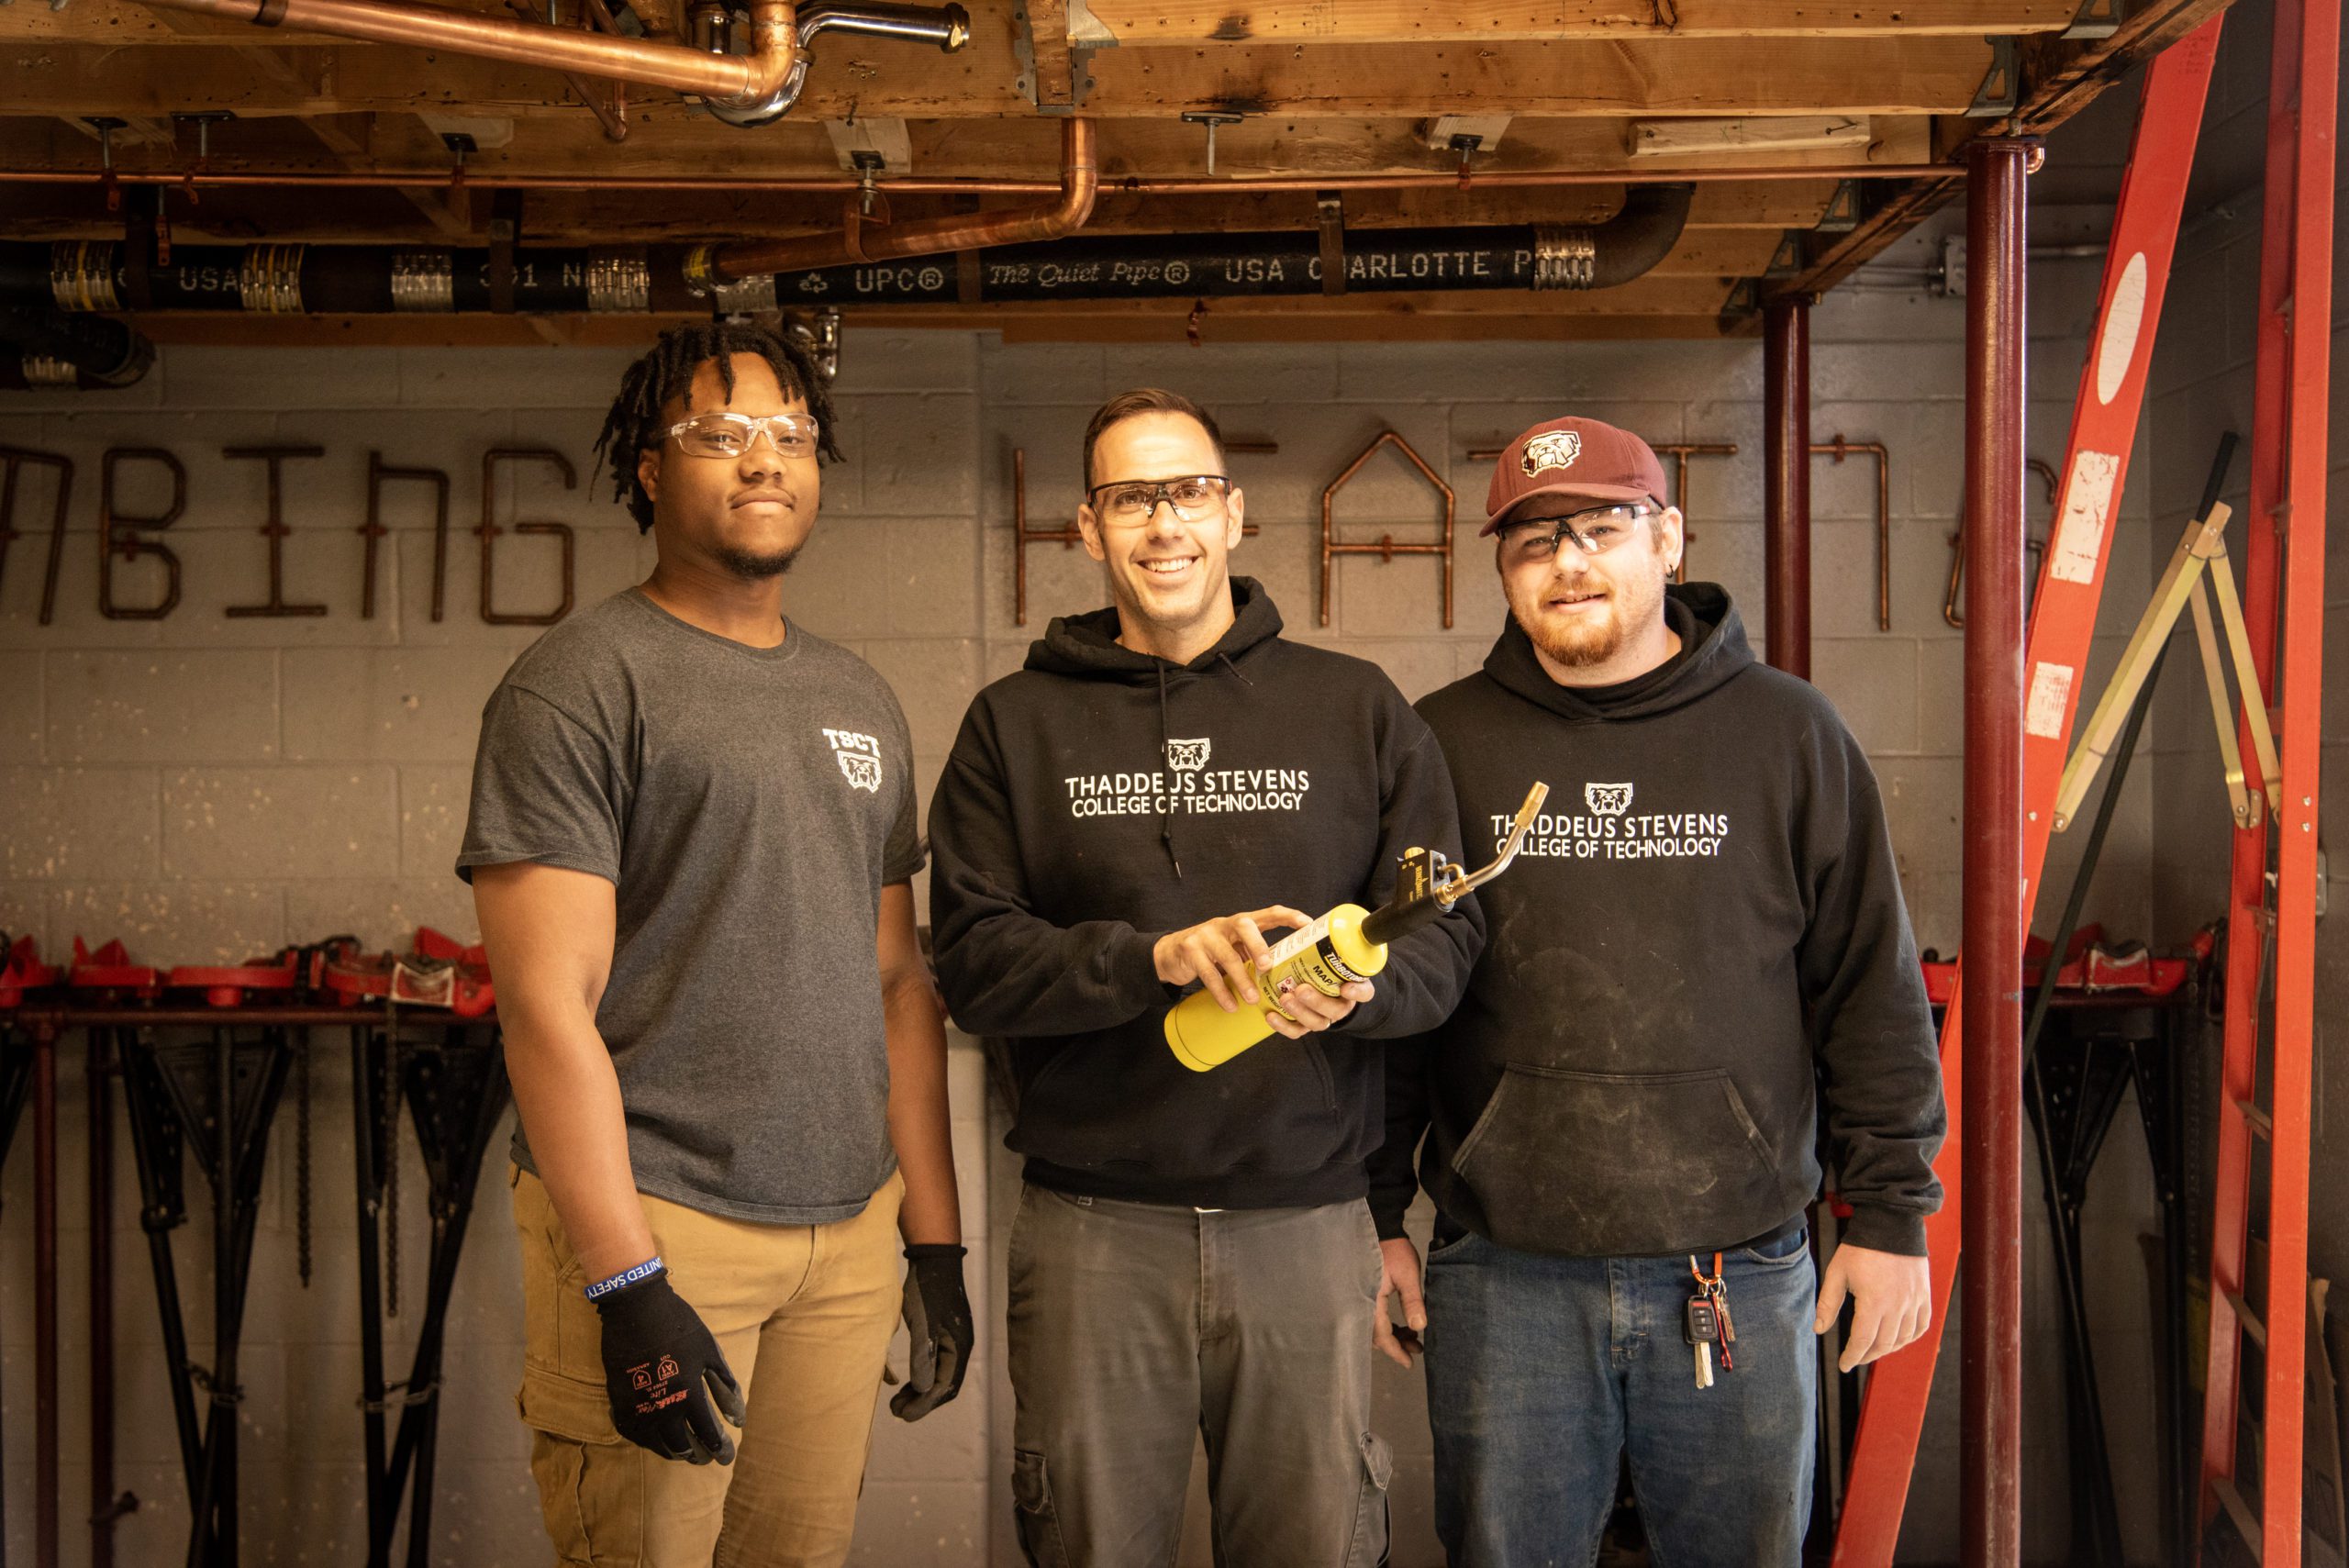
Students in the Plumbing Technology program learn how to design, install, and repair residential and commercial plumbing systems and hydronic heating systems. Some of the skills acquired are joining different types of piping materials, reading blueprints, and installing and repairing boilers, plumbing fixtures, faucets, and water heaters.
Employment opportunities in the plumbing and pipe-fitting industries include the installation of plumbing and heating systems in new buildings and the installation and maintenance of plumbing, heating, and piping systems for industries, public utilities, or government agencies. Self-employment is another option. Many graduates become self-employed plumbers after completing their apprenticeships.
What you’ll learn
- Apply safety principles and demonstrate good work habits in the trade.
- Use the hand and power tools of the trade.
- Identify piping materials and install them using proper connections.
- Use and apply trade terms and technical data.
- Read and interpret blueprints, specifications, and codes as they apply to the trade.
- Lay out, estimate, calculate, and use mathematical skills as required in the trade.
- Install, maintain, and repair plumbing, heating, and mechanical systems and equipment.
- Keep abreast of new developments in the field.
- Demonstrate the ability to write letters of application, memos, work orders, reports, and apply communication skills in the world of work.
Sample Job Titles
Assemble, install, or repair pipes, fittings, or fixtures of heating, water, or drainage systems, according to specifications or plumbing codes.
Drain Technician, Fire Sprinkler Service Technician, Pipe Fitter, Pipe Welder, Pipefitter, Plumber, Residential Plumber, Service Plumber, Sprinkler Fitter, Steamfitter
Quick facts
Location
Woolworth Building, Main Campus
Type of program
Associate Degree
Job/Salary Outlook
See industry data
Length of program
2 years, 73 credits
Cost of program
$4,500/semester tuition
$3,000 – $3,500/semester housing
$1,850 – $2,335/semester meal plan
Tool List (PDF)

The outcomes speak for themselves
Graduates of this program can read blueprints, fix pipes and plumbing fixtures, and install and repair boilers.
90%
employment
$45K
med. salary
People of TSCT
Success stories

Program details
Courses
MODEL SCHEDULE FOR PLUMBING TECHNOLOGY
Semester 1
- PLBG 107 The Plumbing Trade (3 credits)
- PLBG 112 Plumbing Design I: Intro to Plumbing Systems (3 credits)
- PLBG 117 Plumbing Installation I (a): Plumbing Materials (3 credits)
- PLBG 122 Plumbing Installation I (b): Plumbing Tools (1.5 credits)
- PLBG 130 Construction Blueprint Reading (1.5 credits)
- MATH 126 Technical Mathematics I (or higher) (3 credits)
- ENG 106 English Composition (3 credits)
- HEAL 111 Basic First Aid (1 credit)
Semester 2
- PLBG 156 Plumbing Design II: Blueprint Reading (3 credits)
- PLBG 170 Plumbing Installation II (a): Underground and Aboveground Rough-In (3 credits)
- PLBG 176 Plumbing Installation II (b): Fixture Installation (3 credits)
- PLBG 167 Plumbing Service I: Intro (3 credits)
- MATH Elective (3 credits)
- CIS 111 Intro to Computer Applications (3 credits)
Semester 3
- PLBG 207 Plumbing Design III: Plumbing Codes (3 credits)
- PLBG 213 Plumbing Installation III (3 credits)
- PLBG 216 Plumbing Installation IV: Commercial Plumbing Installation (3 credits)
- PLBG 223 Plumbing Service II: Advanced Plumbing Services (3 credits)
- Science Elective (3 credits)
- Humanities Elective (3 credits)
Semester 4
- PLBG 256 Plumbing Design IV: Designing Hydronic Heating Systems (3 credits)
- PLBG 262 Plumbing Installation V (3 credits)
- PLBG 267 Plumbing Service III (3 credits)
- PLBG 272 Plumbing Installation VI (3 credits)
- ELECTIVE General Education Elective (3 credits)
- BUSN 106 Small Business Management (3 credits)
Total Credits 73
Faculty
Occupational Advisory Committee
The Occupational Advisory Committee (OAC) serves as a vital link between the Program of study and industry, ensuring that the program remains aligned with current workforce needs, technological advancements, and best practices in the field. Composed of employers, educators, and other community members, the committee provides guidance, feedback, and recommendations to enhance the curriculum, instructional methods, and student learning experiences.
Purpose and Responsibilities:
- Curriculum & Industry Alignment
- Workforce Readiness
- Student & Faculty Support
- Internship & Employment Connections
- Accreditation & Program Evaluation
- Facilities & Equipment Recommendations
By fostering a strong relationship between academia and industry, the OAC helps ensure that Thaddeus Stevens College programs maintain the highest standards in CTE (career and technical education).
- Justin Fisher, Homeclimates
- Greg Weikel, Swartley Bros. Engineers, Inc.
Essential Skills Learned
Tasks
- Measure, cut, thread, or bend pipe to required angle, using hand or power tools or machines such as pipe cutters, pipe-threading machines, or pipe-bending machines.
- Study building plans and inspect structures to assess material and equipment needs, establish the sequence of pipe installations, and plan installation around obstructions such as electrical wiring.
- Locate and mark the position of pipe installations, connections, passage holes, or fixtures in structures, using measuring instruments such as rulers or levels.
- Fill pipes or plumbing fixtures with water or air and observe pressure gauges to detect and locate leaks.
- Assemble pipe sections, tubing, or fittings, using couplings, clamps, screws, bolts, cement, plastic solvent, caulking, or soldering, brazing, or welding equipment.
- Install pipe assemblies, fittings, valves, appliances such as dishwashers or water heaters, or fixtures such as sinks or toilets, using hand or power tools.
- Direct helpers engaged in pipe cutting, preassembly, or installation of plumbing systems or components.
- Cut openings in structures to accommodate pipes or pipe fittings, using hand or power tools.
- Review blueprints, building codes, or specifications to determine work details or procedures.
- Install underground storm, sanitary, or water piping systems, extending piping as needed to connect fixtures and plumbing.
Tools used in this occupation
- Drain or pipe cleaning equipment — Drain cleaning cables; Hand spinners; Power sink machine drain cleaners; Toilet augers
- Pipe or tube cutters — Copper cutting machines; Power pipe cutters; Ratcheting polyvinyl chloride PVC cutters; Tubing cutters
- Pressure indicators — Air pressure gauges; Heavy-duty water pressure gauges; Maximum reading water pressure gauges; Water pressure gauges
- Pullers — Compression sleeve pullers; Faucet handle pullers; Faucet stem and cartridge pullers; Tub drain removers
- Specialty wrenches — Chain wrenches; Spud wrenches; Strainer wrenches; Water heater element removal wrenches
Technology used in this occupation
- Accounting software — Intuit QuickBooks software; Intuit Quicken software; Job costing software; KRS Enterprises Service First!
- Analytical or scientific software — Elite Software DPIPE; Elite Software FIRE; Klear Estimator; Quote Software QuoteExpress
- Computer-aided design CAD software — Autodesk Building Systems; Elite Software Plumbing CAD; Elite Software Sprinkler CAD; Horizon Engineering Sigma Plumbing Calculator
- Database user interface and query software — Database software; Insight Direct ServiceCEO; PricePoint software; Wintac Pro Software
- Word processing software — Atlas Construction Business Forms; Contractor City Contractor Forms Pack; Microsoft Word; Wilhelm Publishing Threshold
Knowledge
- Building and Construction — Knowledge of materials, methods, and the tools involved in the construction or repair of houses, buildings, or other structures such as highways and roads.
- Mechanical — Knowledge of machines and tools, including their designs, uses, repair, and maintenance.
- Mathematics — Knowledge of arithmetic, algebra, geometry, calculus, statistics, and their applications.
- Design — Knowledge of design techniques, tools, and principles involved in the production of precision technical plans, blueprints, drawings, and models.
- Customer and Personal Service — Knowledge of principles and processes for providing customer and personal services. This includes customer needs assessment, meeting quality standards for services, and evaluation of customer satisfaction.
- English Language — Knowledge of the structure and content of the English language including the meaning and spelling of words, rules of composition, and grammar.
- Physics — Knowledge, and prediction of physical principles, laws, their interrelationships, and applications to understanding fluid, material, and atmospheric dynamics, and mechanical, electrical, atomic, and subatomic structures and processes.
- Administration and Management — Knowledge of business and management principles involved in strategic planning, resource allocation, human resources modeling, leadership technique, production methods, and coordination of people and resources.
Skills
- Critical Thinking — Using logic and reasoning to identify the strengths and weaknesses of alternative solutions, conclusions, or approaches to problems.
- Active Listening — Giving full attention to what other people are saying, taking time to understand the points being made, asking questions as appropriate, and not interrupting at inappropriate times.
- Complex Problem Solving — Identifying complex problems and reviewing related information to develop and evaluate options and implement solutions.
- Reading Comprehension — Understanding written sentences and paragraphs in work-related documents.
- Judgment and Decision Making — Considering the relative costs and benefits of potential actions to choose the most appropriate one.
- Monitoring — Monitoring/Assessing performance of yourself, other individuals, or organizations to make improvements or take corrective action.
- Operation Monitoring — Watching gauges, dials, or other indicators to make sure a machine is working properly.
- Quality Control Analysis — Conducting tests and inspections of products, services, or processes to evaluate quality or performance.
- Speaking — Talking to others to convey information effectively.
- Operation and Control — Controlling operations of equipment or systems.
Abilities
- Arm-Hand Steadiness — The ability to keep your hand and arm steady while moving your arm or while holding your arm and hand in one position.
- Finger Dexterity — The ability to make precisely coordinated movements of the fingers of one or both hands to grasp, manipulate, or assemble very small objects.
- Control Precision — The ability to quickly and repeatedly adjust the controls of a machine or a vehicle to exact positions.
- Multilimb Coordination — The ability to coordinate two or more limbs (for example, two arms, two legs, or one leg and one arm) while sitting, standing, or lying down. It does not involve performing the activities while the whole body is in motion.
- Problem Sensitivity — The ability to tell when something is wrong or is likely to go wrong. It does not involve solving the problem, only recognizing there is a problem.
- Deductive Reasoning — The ability to apply general rules to specific problems to produce answers that make sense.
- Extent Flexibility — The ability to bend, stretch, twist, or reach with your body, arms, and/or legs.
- Near Vision — The ability to see details at close range (within a few feet of the observer).
- Inductive Reasoning — The ability to combine pieces of information to form general rules or conclusions (includes finding a relationship among seemingly unrelated events).
- Manual Dexterity — The ability to quickly move your hand, your hand together with your arm, or your two hands to grasp, manipulate, or assemble objects.
Work Activities
- Getting Information — Observing, receiving, and otherwise obtaining information from all relevant sources.
- Handling and Moving Objects — Using hands and arms in handling, installing, positioning, and moving materials, and manipulating things.
- Making Decisions and Solving Problems — Analyzing information and evaluating results to choose the best solution and solve problems.
- Updating and Using Relevant Knowledge — Keeping up-to-date technically and applying new knowledge to your job.
- Organizing, Planning, and Prioritizing Work — Developing specific goals and plans to prioritize, organize, and accomplish your work.
- Performing General Physical Activities — Performing physical activities that require considerable use of your arms and legs and moving your whole body, such as climbing, lifting, balancing, walking, stooping, and handling of materials.
- Controlling Machines and Processes — Using either control mechanisms or direct physical activity to operate machines or processes (not including computers or vehicles).
- Operating Vehicles, Mechanized Devices, or Equipment — Running, maneuvering, navigating, or driving vehicles or mechanized equipment, such as forklifts, passenger vehicles, aircraft, or watercraft.
- Identifying Objects, Actions, and Events — Identifying information by categorizing, estimating, recognizing differences or similarities, and detecting changes in circumstances or events.
- Inspecting Equipment, Structures, or Material — Inspecting equipment, structures, or materials to identify the cause of errors or other problems or defects.
Work Context
- Spend Time Using Your Hands to Handle, Control, or Feel Objects, Tools, or Controls — How much does this job require using your hands to handle, control, or feel objects, tools, or controls?
- Telephone — How often do you have telephone conversations in this job?
- Face-to-Face Discussions — How often do you have to have face-to-face discussions with individuals or teams in this job?
- Freedom to Make Decisions — How much decision-making freedom, without supervision, does the job offer?
- Work With Work Group or Team — How important is it to work with others in a group or team in this job?
- Frequency of Decision Making — How frequently is the worker required to make decisions that affect other people, the financial resources, and/or the image and reputation of the organization?
- Impact of Decisions on Co-workers or Company Results — How do the decisions an employee makes impact the results of co-workers, clients, or the company?
- Contact With Others — How much does this job require the worker to be in contact with others (face-to-face, by telephone, or otherwise) in order to perform it?
- Structured versus Unstructured Work — To what extent is this job structured for the worker, rather than allowing the worker to determine tasks, priorities, and goals?
- Importance of Being Exact or Accurate — How important is being very exact or highly accurate in performing this job?
Interests
- Realistic — Realistic occupations frequently involve work activities that include practical, hands-on problems, and solutions. They often deal with plants, animals, and real-world materials like wood, tools, and machinery. Many of the occupations require working outside and do not involve a lot of paperwork or working closely with others.
- Conventional — Conventional occupations frequently involve following set procedures and routines. These occupations can include working with data and details more than with ideas. Usually, there is a clear line of authority to follow.
- Investigative — Investigative occupations frequently involve working with ideas and require an extensive amount of thinking. These occupations can involve searching for facts and figuring out problems mentally.
Work Styles
- Dependability — Job requires being reliable, responsible, and dependable, and fulfilling obligations.
- Attention to Detail — Job requires being careful about detail and thorough in completing work tasks.
- Cooperation — Job requires being pleasant with others on the job and displaying a good-natured, cooperative attitude.
- Integrity — Job requires being honest and ethical.
- Achievement/Effort — Job requires establishing and maintaining personally challenging achievement goals and exerting effort toward mastering tasks.
- Leadership — Job requires a willingness to lead, take charge, and offer opinions and direction.
- Independence — Job requires developing one’s own ways of doing things, guiding oneself with little or no supervision, and depending on oneself to get things done.
- Initiative — Job requires a willingness to take on responsibilities and challenges.
- Self-Control — Job requires maintaining composure, keeping emotions in check, controlling anger, and avoiding aggressive behavior, even in very difficult situations.
- Persistence — Job requires persistence in the face of obstacles.
Work Values
- Independence — Occupations that satisfy this work value allow employees to work on their own and make decisions. Corresponding needs are Creativity, Responsibility, and Autonomy.
- Relationships — Occupations that satisfy this work value allow employees to provide service to others and work with co-workers in a friendly non-competitive environment. Corresponding needs are Co-workers, Moral Values, and Social Service.
- Working Conditions — Occupations that satisfy this work value offer job security and good working conditions. Corresponding needs are Activity, Compensation, Independence, Security, Variety, and Working Conditions.
Performance Measures
Internal Key Performance Indicators (Sources: Internal data collections, and Post-Graduate Surveys)
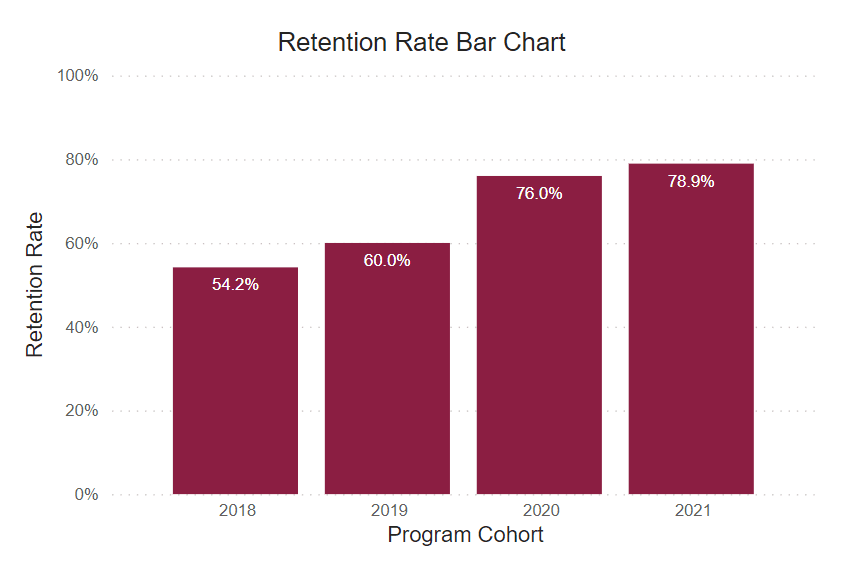
Retention Rate
This rate reflects the continuous term-to-term persistence rate for certificate programs and the fall-to-fall retention rate for associate degree programs.
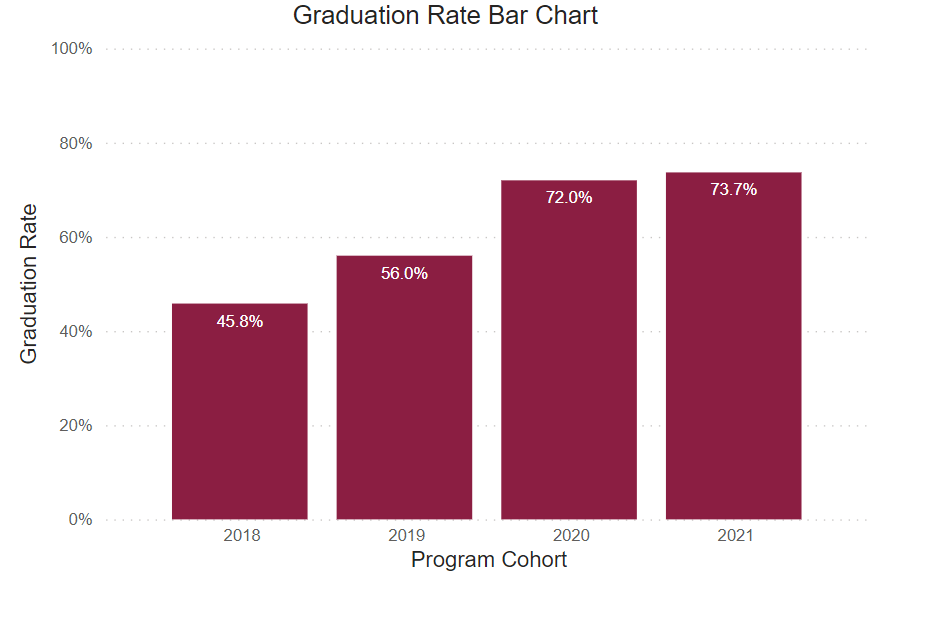
Graduation Rate
This rate reflects the number of freshmen who were officially enrolled in the fall semester and earned a certificate or degree within the expected timeframe.
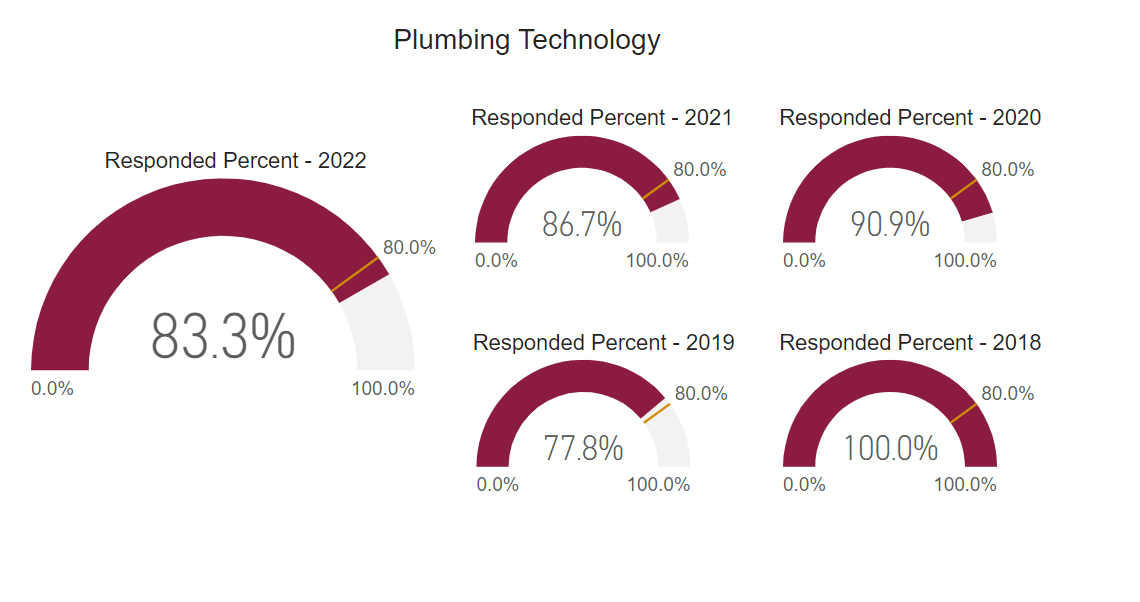
Post Graduate Survey Response Rate
The post graduate survey is an annual on-line post graduate survey utilized by the college to gather vital information regarding career placement, starting salary, and level of satisfaction.
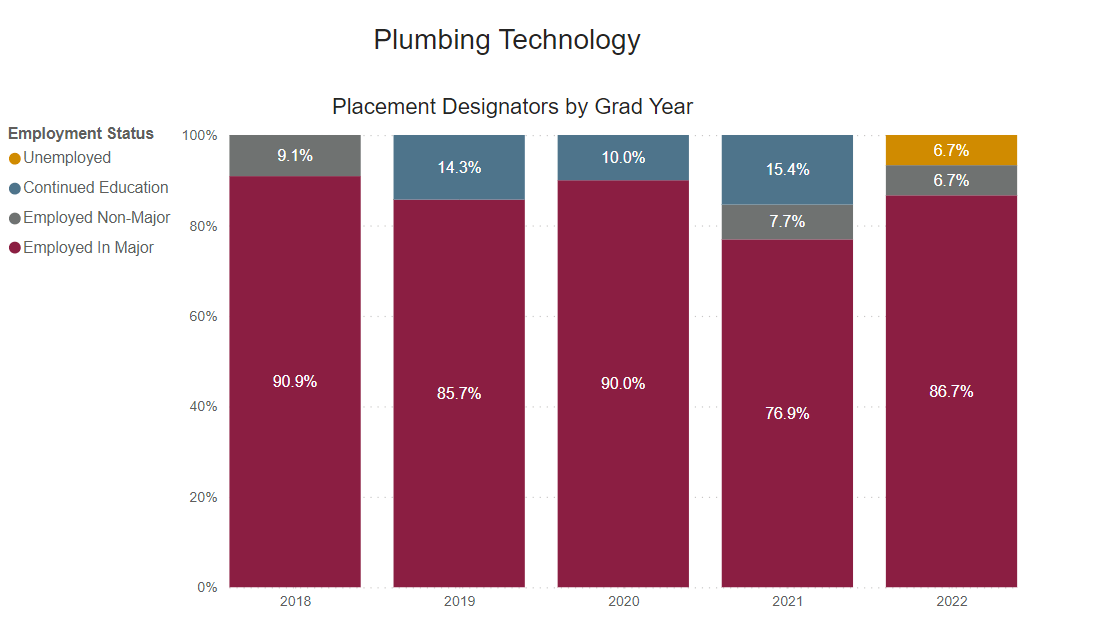
Employed Full Time Outside of Major
Percentage of graduates who reported being employed full-time outside their field of study.
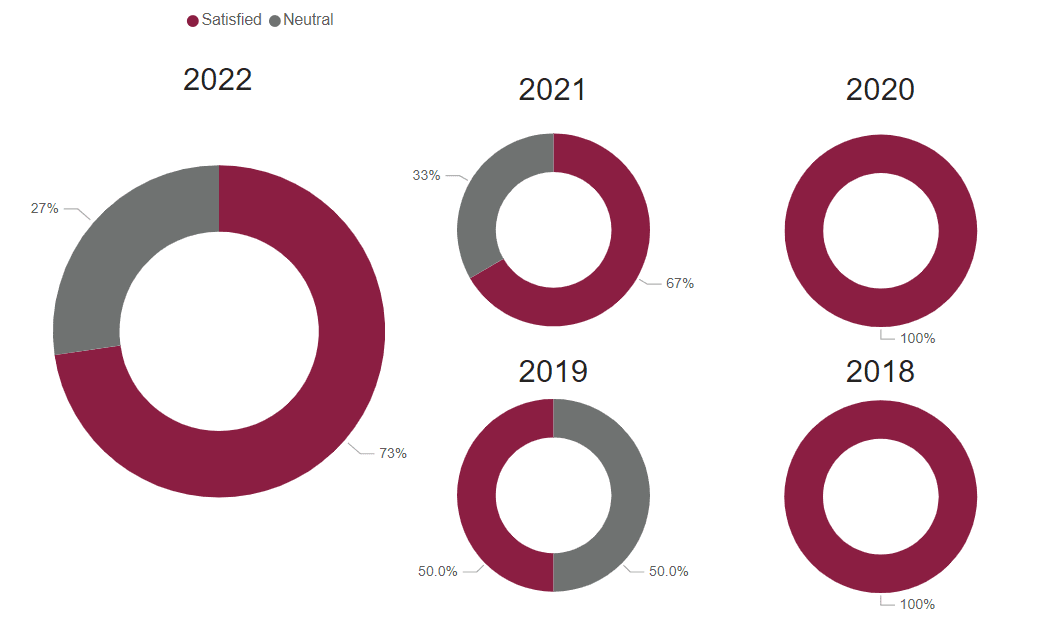
Graduate Satisfaction
This is the median graduate survey response evaluating the level of preparation for workforce entry (based on a 5-Item Likert Scale).
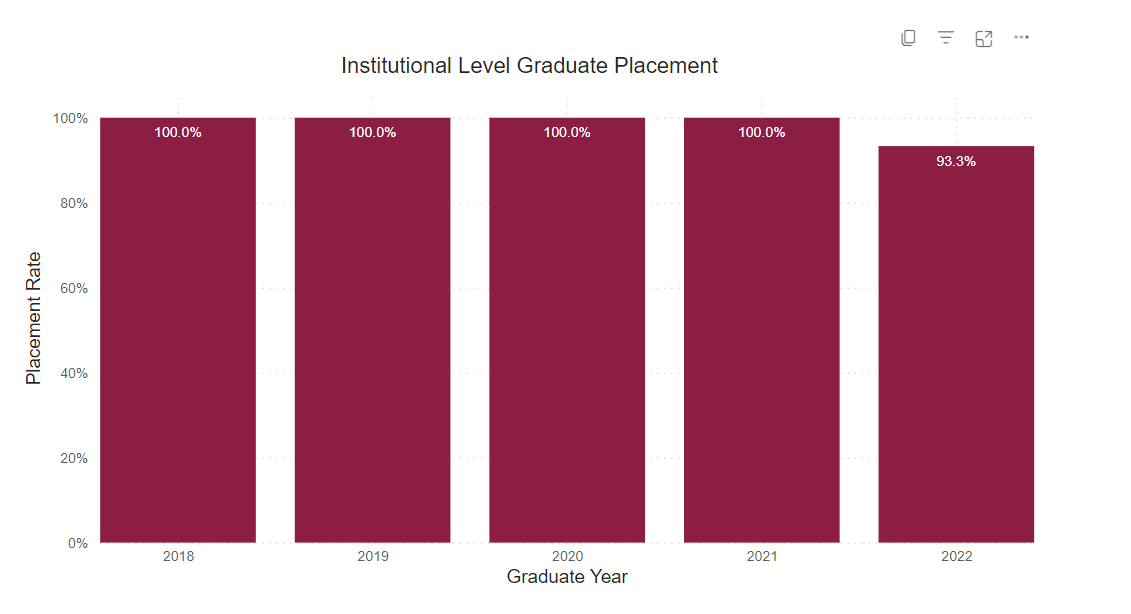
Placement Rate
This is the percent of graduate survey respondents who reported being employed or continued their education on a full-time basis.
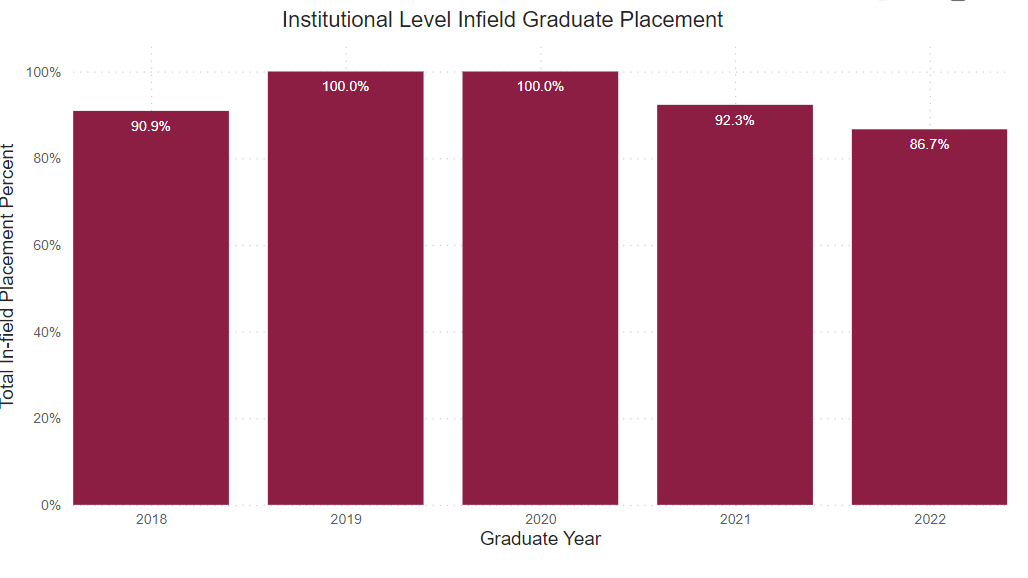
Employed Full Time Within Major
Percentage of graduates who reported being employed full-time within their field of study.
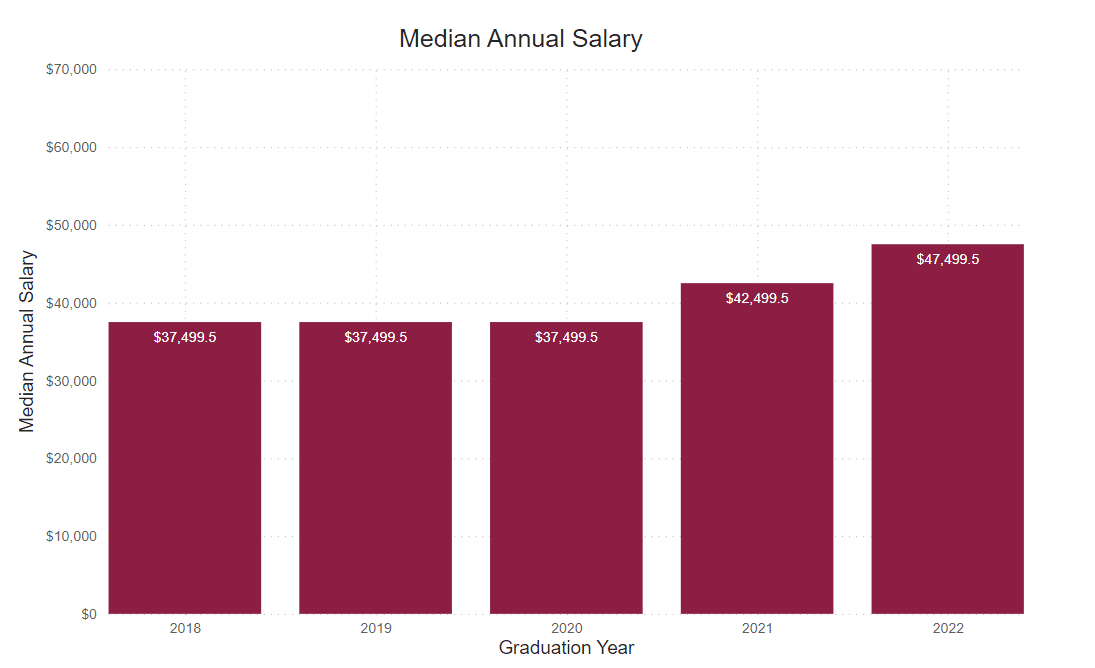
Annual Median Starting Salary
This number is based on the graduate survey response to the request to identify a starting salary from a range of options. This graph shows the median first-year annual salary. All calculations are based on the respondent’s self-reported first-year annual income.
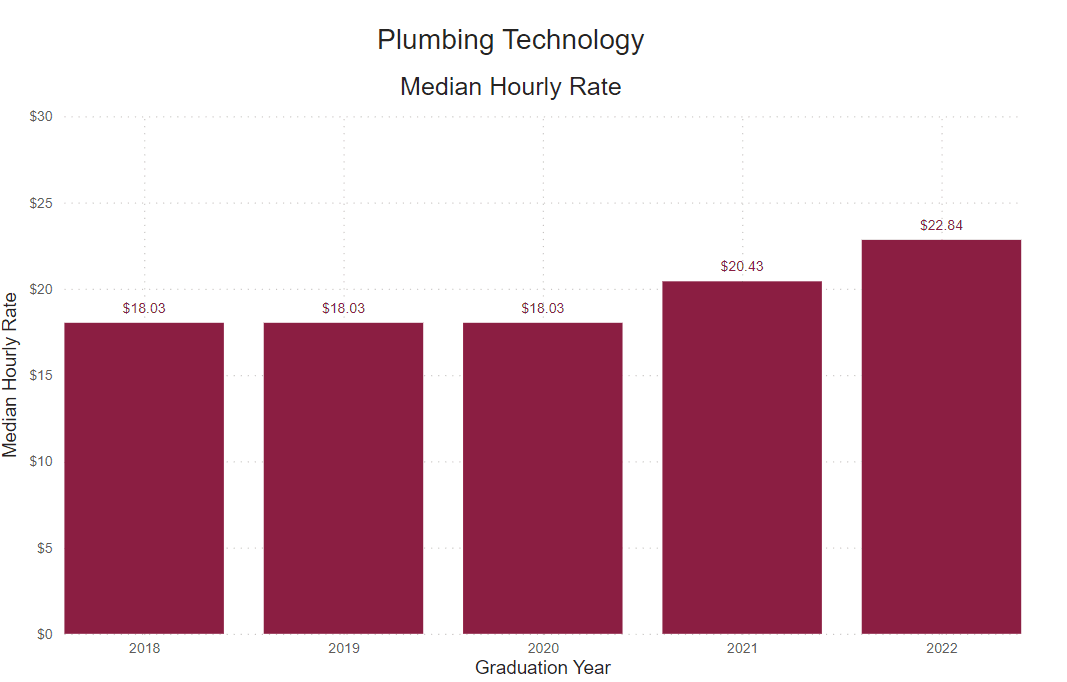
Reported Hourly Rate
This number is determined by dividing the reported median salary by the number of hours in a traditional full-time work week (40), then the number of weeks in a year (52).

Our graduates work with the industry’s best
