Residential Remodeling Technology
Get started today
About Residential Remodeling Technology
Residential remodeling has become an essential part of the construction industry. Remodelers add living space to existing homes and retrofit homes to modern conveniences and updated building codes. Remodeling can be done not only for cosmetic purposes but also for structural reasons, as well as to increase the energy efficiency of older homes.
Jobs available in the residential remodeling field include but are not limited to carpenters; painters; drywall and ceiling tile installers; roofers; woodworkers; kitchen and bath remodelers; siding, roofing, and aluminum installers; and flooring specialists.
Upon graduation, students of the Residential Remodeling program will have a number of different opportunities available. In addition to working in their field, graduates will also have the chance to continue their education in areas such as project management, technical education, residential designer, civil engineering, and structural engineering degrees. Advanced opportunities as crew leaders, supervisors, assistant supervisors, superintendents and small business owners may also be possible for graduates of the program.
What you’ll learn
- Understand the history of residential buildings in the 20th and 21st centuries.
- Demonstrate basic carpentry woodworking skills.
- Demonstrate successful use of basic and advanced tools of the profession.
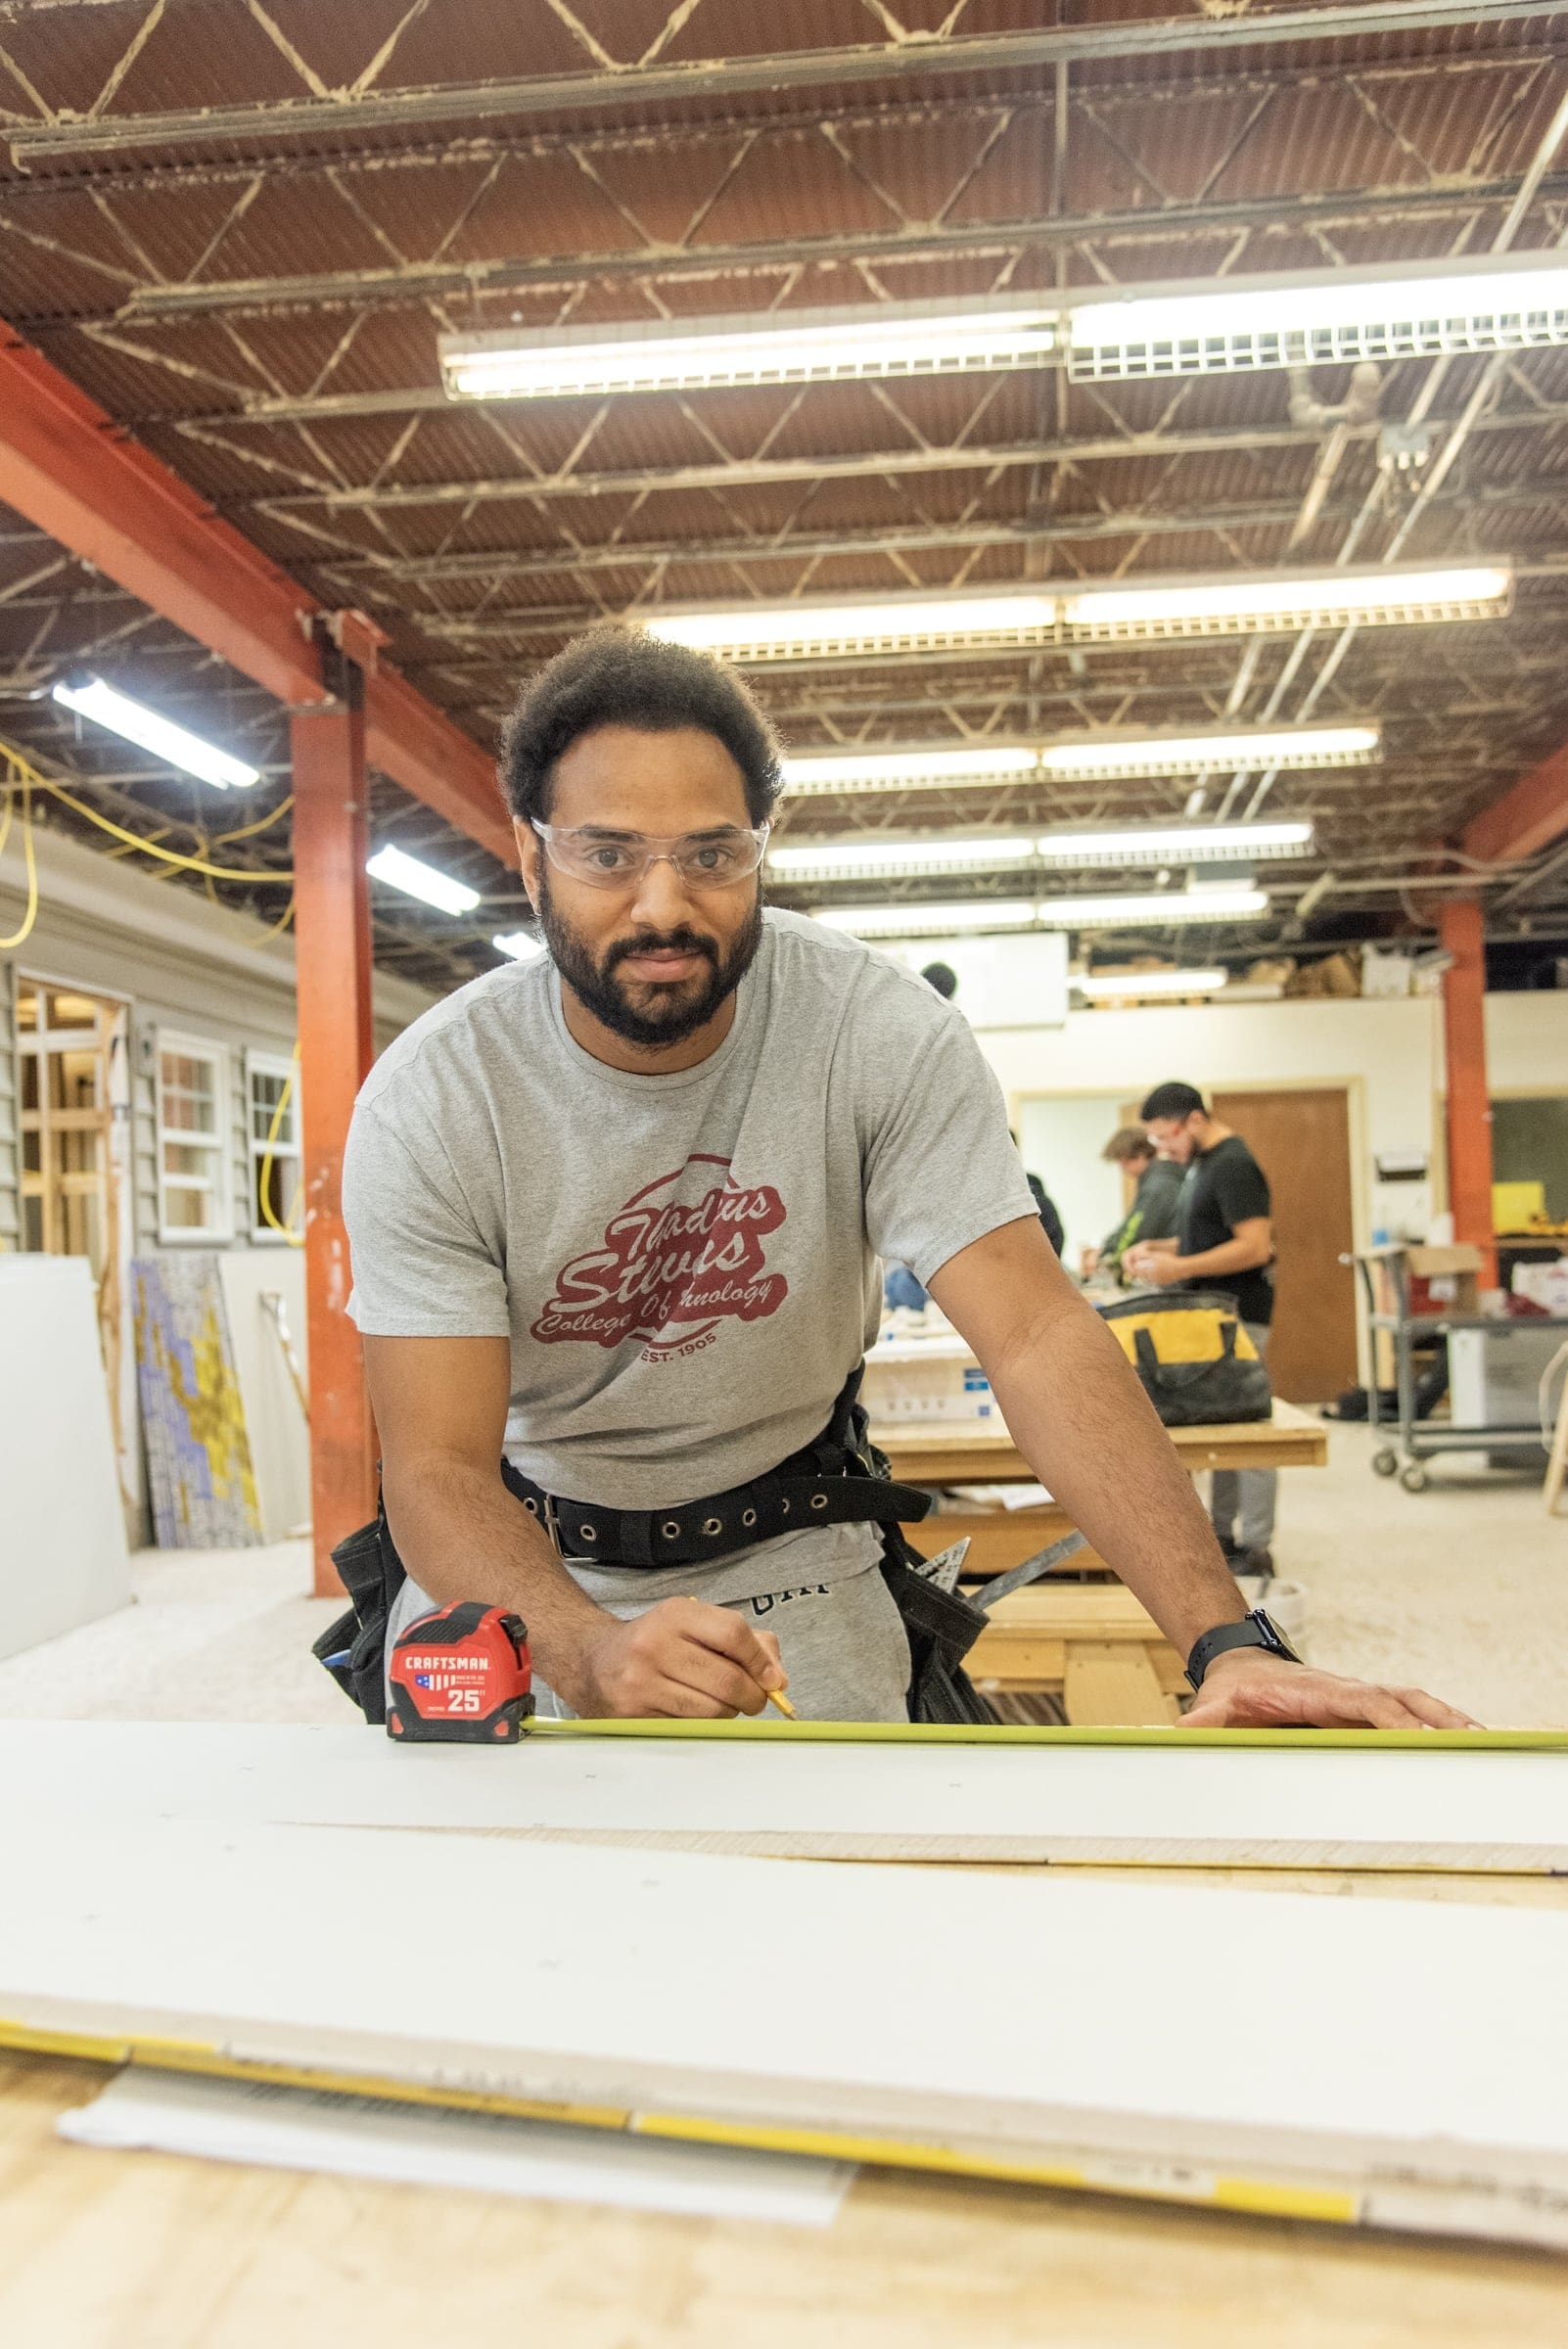
- Read blueprints to lay out projects necessary to complete tasks.
- Calculate material quantities and estimate time allowances for projects using mathematical skills required in the profession.
- Apply remodeling skills necessary for interior, exterior, kitchen, and bathroom projects.
- Operate masonry tools and equipment safely and effectively.
- Complete basic masonry repairs.
- Identify and rectify basic plumbing problems in an existing dwelling.
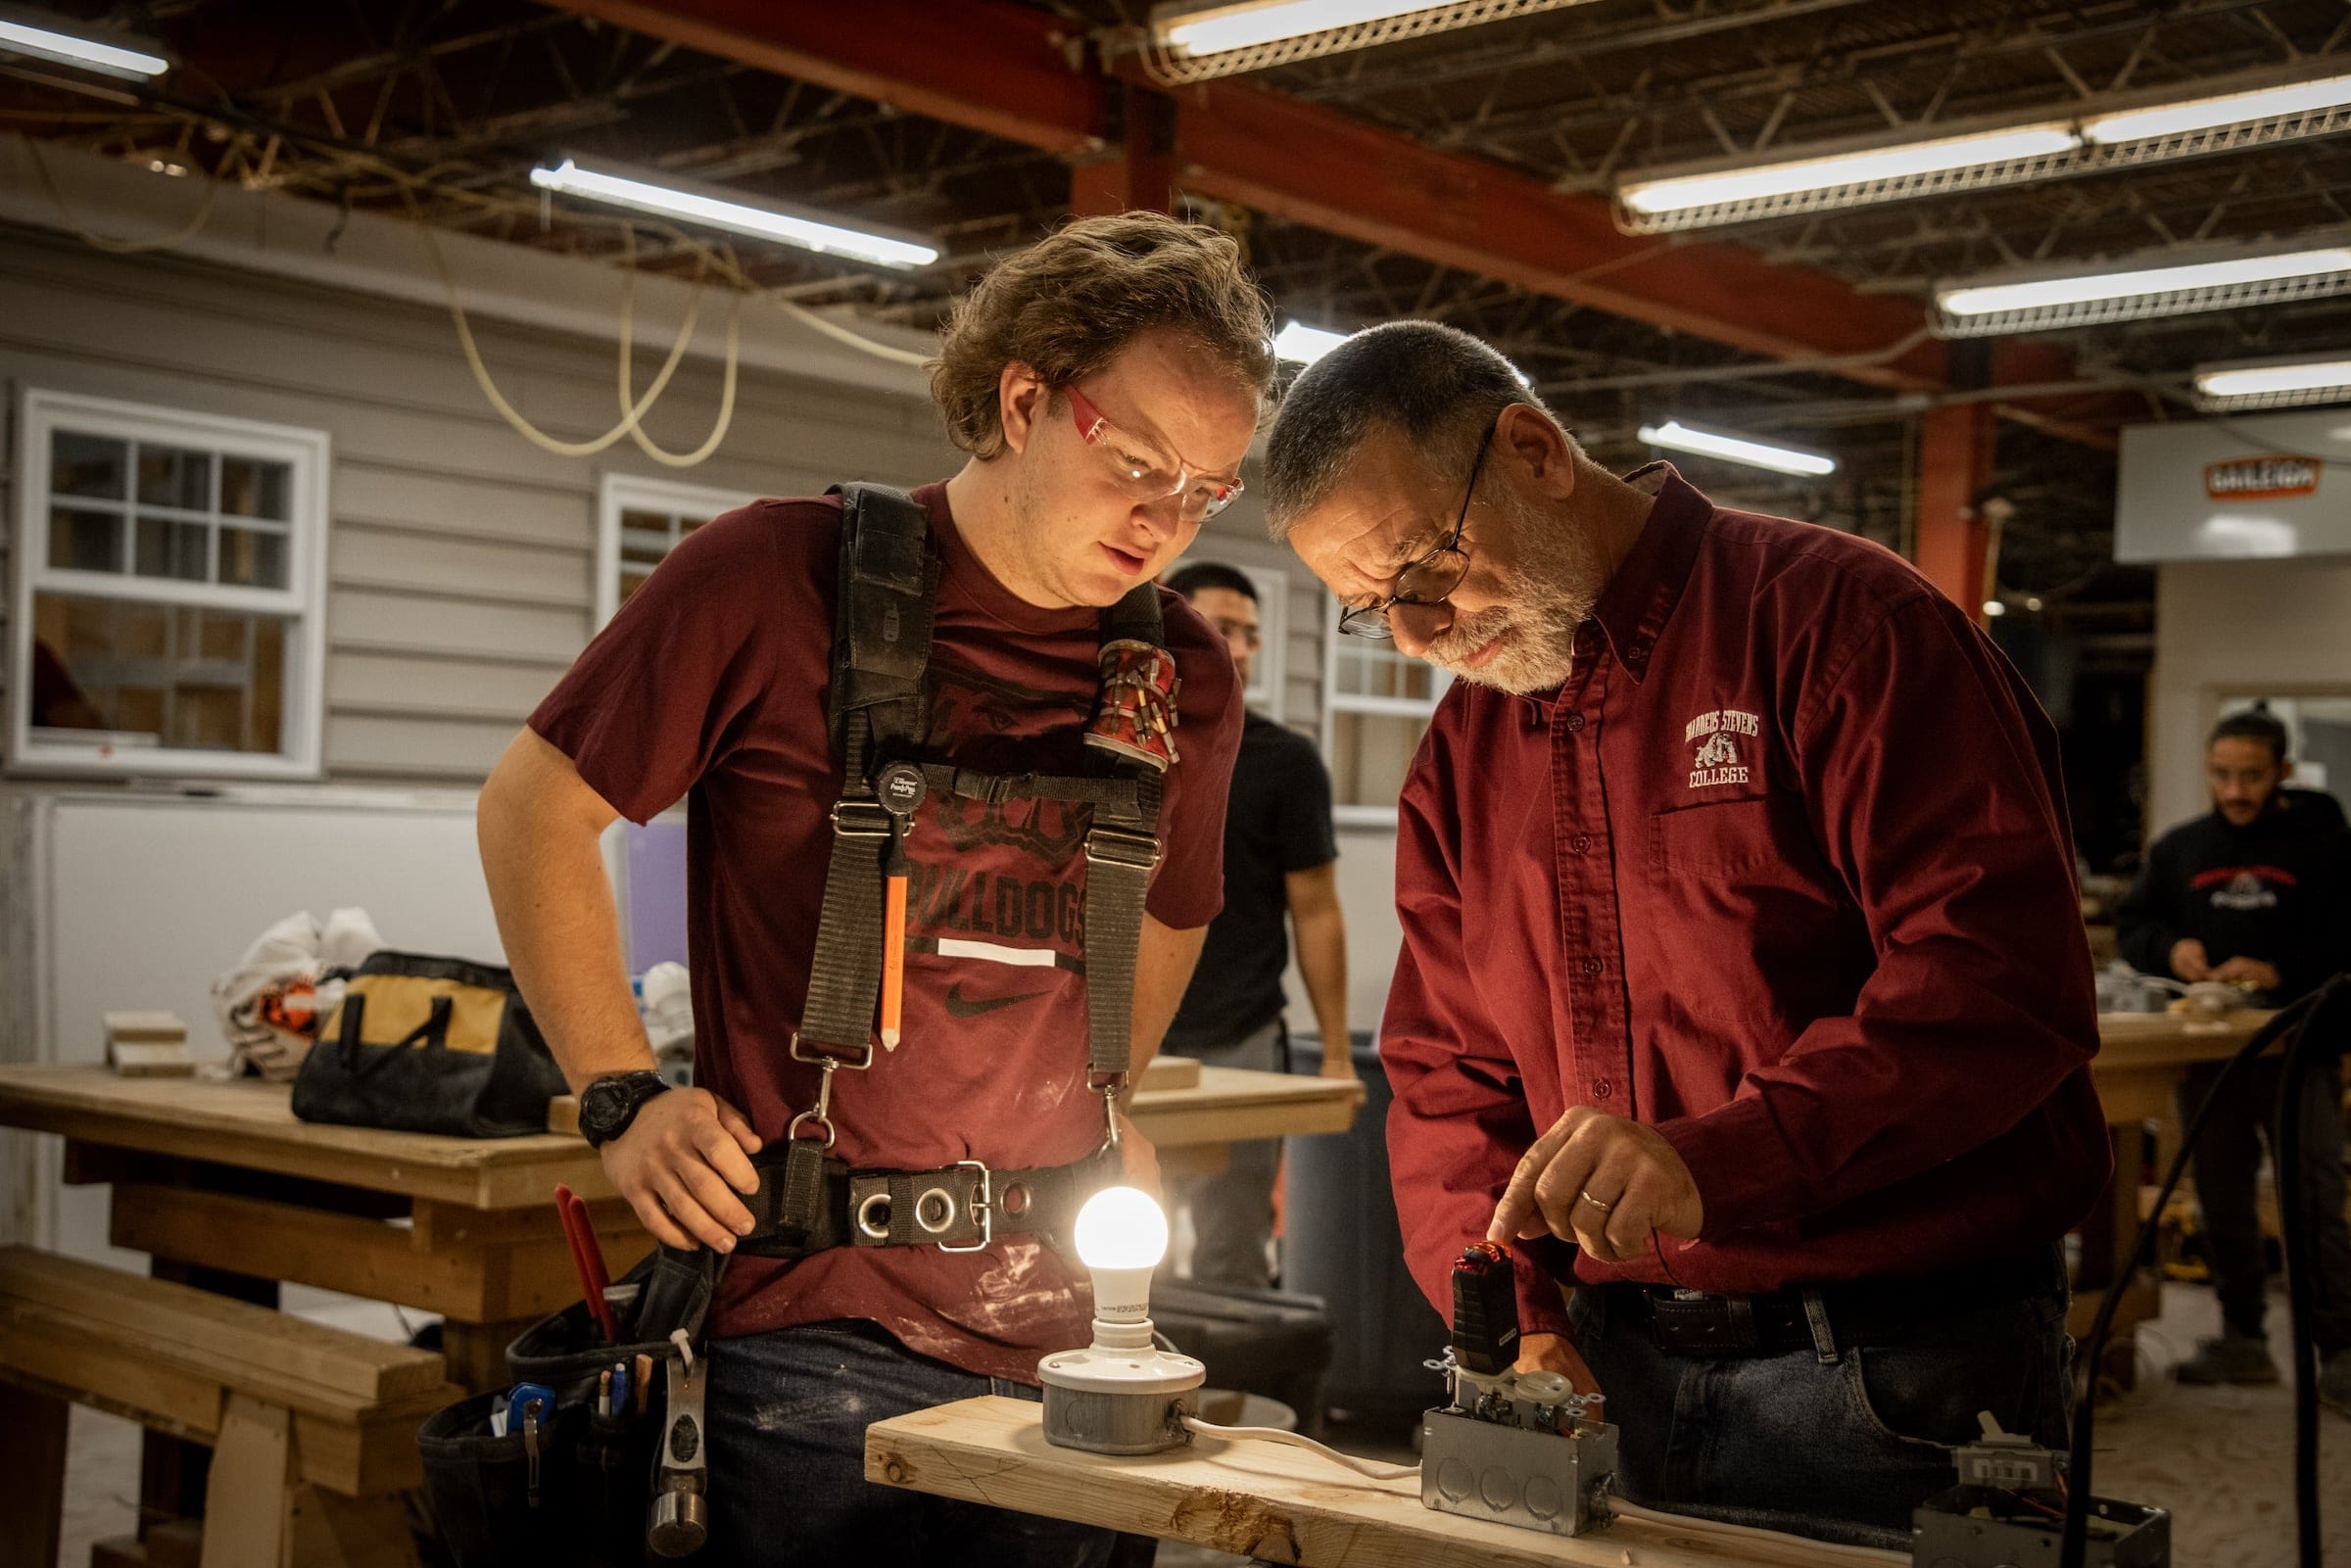
- Troubleshoot basic electrical circuits found in a dwelling.
- Practice safety in the lab and on-site environments.
- Demonstrate a strong work ethic and the ability to work both independently and as a contributing member of a team.
- Stay current with any new technology or codes related to remodeling.
Sample Job Titles
General remodeling skills may include all phases of carpentry, insulation drywall work, painting and finishing, tile work, roofing, siding, aluminum brake work, trim, electrical work, plumbing work, masonry, bricklaying, reading and interpretation of plans
Carpenters, Construction Laborers, Painters, Construction and Maintenance, Cabinetmakers and Bench Carpenters, Painters, Construction and Maintenance, Concrete Finishers, Drywall, and Ceiling Tile Installers, Roofers, Helpers—Carpenters, Stonemasons, Woodworkers, All Other Helpers—Electricians,
Tile and Marble Setters, Construction and Related Workers, All Other Plasterers and Stucco Masons,
Floor Layers, Except Carpet, Wood, and Hard Tiles
Soar Agreements
This program enables students to apply certain credits earned in high school to the credits needed for a degree or certificate through Thaddeus Stevens College. The Residential Remodeling Technology degree qualifies for this program – see our SOAR program page for details!
Quick facts
Location
Snyder Building, Main Campus
Type of program
Associate Degree
Job/Salary Outlook
See industry data
Length of program
2 years, 73 credits
Cost of program
$4,500/semester tuition
$3,000 – $3,500/semester housing
$1,850 – $2,335/semester meal plan
Tool List: First-year, Second-year (PDF)
The outcomes speak for themselves
Graduates of the Residential Remodeling program can work in a variety of roles, continue their education, or roles as crew leaders and assistant superintendents.
100%
employment
$47.5K
med. salary
People of TSCT
Success stories

Program details
Courses
MODEL SCHEDULE FOR RESIDENTIAL REMODELING TECHNOLOGY
Semester 1
- RMDL 106 – Remodeling Hand and Power Tools (3 credits)
- RMDL 111 – Building Materials (3 credits)
- CARP 157 – Floor, Wall, and Ceiling Framing (3 credits)
- CARP 182 – Blueprint Reading (3 credits)
- MATH 126 – Technical Mathematics I
(OR higher-level math) (3 credits) - ENG 106 – English Composition (3 credits)
Semester 2
- CARP 116 – Building Site and Foundations (3 credits)
- CARP 161 – Stair Construction and Remodeling (2 credits)
- CARP 166 – Roofing & Exterior Finishes (3 credits)
- CARP 177 – Interior & Exterior Finishes (3 credits)
- MATH 132 – Elementary Geometry
(OR higher-level math) (3 credits) - CIS 111 – Intro. to Computer Applications (3 credits)
Semester 3
- RMDL 206 – Remodeling Drafting and Design (3 credits)
- RMDL 210 – Demolition and Stabilization (2 credits)
- RMDL 216 – Estimating and Scheduling (3 credits)
- RMDL 221 – Remodeling and Electro-Mechanical Systems (2 credits)
- RMDL 250 – Insulation and Weatherization (2 credits)
- SCIENCE – Elective (3 credits)
- ENG 216 – Technical Writing OR ENG 221 Public Speaking (3 credits)
Semester 4
- CARP 272 – Site Work and Foundations II (2 credits)
- RMDL 260 – Kitchen and Bath Remodeling (3 credits)
- RMDL 270 – Advanced Interior Finishes (4 credits)
- RMDL 280 – Advanced Exterior Finishes (3 credits)
- BUSN 106 – Small Business Management (3 credits)
- HEAL Elective – HEAL 106 OR HEAL 111 (1 credit)
- HUMANITIES – Elective (3 credits)
Total Credits 73
Faculty
Occupational Advisory Committee
The Occupational Advisory Committee (OAC) serves as a vital link between the Program of study and industry, ensuring that the program remains aligned with current workforce needs, technological advancements, and best practices in the field. Composed of employers, educators, and other community members, the committee provides guidance, feedback, and recommendations to enhance the curriculum, instructional methods, and student learning experiences.
Purpose and Responsibilities:
- Curriculum & Industry Alignment
- Workforce Readiness
- Student & Faculty Support
- Internship & Employment Connections
- Accreditation & Program Evaluation
- Facilities & Equipment Recommendations
By fostering a strong relationship between academia and industry, the OAC helps ensure that Thaddeus Stevens College programs maintain the highest standards in CTE (career and technical education).
- Mike Blank, MBC Building & Remodeling LLC
- Michael Gerfin, Retired
- Ron Good, Ebersole Brothers
- Todd Goshert, Heck Construction Company, Inc
- Chris Hinton, eciConstruction
- Mike Hockenberry, EG Stoltzfus
- Jacob Komorowski, Komorowski Construction
- Bill Lastinger, Benchmark Construction Company Inc.
- JP Perron, Perron Construction, Inc.
- Jim Weischedel, Sam Smucker & Sons
- Todd Wenger, Wenger Contracting, Inc.
- Nick Yatron, Nationwide Kitchen Installers Inc (NKI)
- Joel Zeiset, Eby Exteriors
Essential Skills Learned
Knowledge
- Building and Construction — Knowledge of materials, methods, and the tools involved in the construction or repair of houses, buildings, or other structures such as highways and roads.
- Mathematics — Knowledge of arithmetic, algebra, geometry, statistics, and their applications.
- Mechanical — Knowledge of machines and tools, including their designs, uses, repair, and maintenance.
- Production and Processing — Knowledge of raw materials, production processes, quality control, costs, and other techniques for maximizing the effective manufacture and distribution of goods.
- Design — Knowledge of design techniques, tools, and principles involved in the production of precision technical plans, blueprints, drawings, and models.
- Administration and Management — Knowledge of business and management principles involved in strategic planning, resource allocation, human resources modeling, leadership technique, production methods, and coordination of people and resources.
- Public Safety and Security — Knowledge of relevant equipment, policies, procedures, and strategies to promote effective local, state, or national security operations for the protection of people, data, property, and institutions.
- Engineering and Technology — Knowledge of the practical application of engineering science and technology. This includes applying principles, techniques, procedures, and equipment to the design and production of various goods and services.
Skills
- Critical Thinking — Using logic and reasoning to identify the strengths and weaknesses of alternative solutions, conclusions, or approaches to problems.
- Equipment Selection — Determining the kind of tools and equipment needed to do a job.
- Operation Monitoring — Watching gauges, dials, or other indicators to make sure a machine is working properly.
Abilities
- Manual Dexterity — The ability to quickly move your hand, your hand together with your arm, or your two hands to grasp, manipulate, or assemble objects.
- Multilimb Coordination — The ability to coordinate two or more limbs (for example, two arms, two legs, or one leg and one arm) while sitting, standing, or lying down. It does not involve performing the activities while the whole body is in motion.
- Problem Sensitivity — The ability to tell when something is wrong or is likely to go wrong. It does not involve solving the problem, only recognizing there is a problem.
- Static Strength — The ability to exert maximum muscle force to lift, push, pull, or carry objects.
- Trunk Strength — The ability to use your abdominal and lower back muscles to support part of the body repeatedly or continuously over time without ‘giving out’ or fatiguing.
- Finger Dexterity — The ability to make precisely coordinated movements of the fingers of one or both hands to grasp, manipulate, or assemble very small objects.
- Near Vision — The ability to see details at close range (within a few feet of the observer).
- Arm-Hand Steadiness — The ability to keep your hand and arm steady while moving your arm or while holding your arm and hand in one position.
- Deductive Reasoning — The ability to apply general rules to specific problems to produce answers that make sense.
- Information Ordering — The ability to arrange things or actions in a certain order or pattern according to a specific rule or set of rules (e.g., patterns of numbers, letters, words, pictures, mathematical operations).
Work Activities
- Inspecting Equipment, Structures, or Material — Inspecting equipment, structures, or materials to identify the cause of errors or other problems or defects.
- Performing General Physical Activities — Performing physical activities that require considerable use of your arms and legs and moving your whole body, such as climbing, lifting, balancing, walking, stooping, and handling of materials.
- Getting Information — Observing, receiving, and otherwise obtaining information from all relevant sources.
- Handling and Moving Objects — Using hands and arms in handling, installing, positioning, and moving materials, and manipulating things.
- Communicating with Supervisors, Peers, or Subordinates — Providing information to supervisors, co-workers, and subordinates by telephone, in written form, e-mail, or in person.
- Making Decisions and Solving Problems — Analyzing information and evaluating results to choose the best solution and solve problems.
- Controlling Machines and Processes — Using either control mechanisms or direct physical activity to operate machines or processes (not including computers or vehicles).
- Identifying Objects, Actions, and Events — Identifying information by categorizing, estimating, recognizing differences or similarities, and detecting changes in circumstances or events.
- Organizing, Planning, and Prioritizing Work — Developing specific goals and plans to prioritize, organize, and accomplish your work.
- Estimating the Quantifiable Characteristics of Products, Events, or Information — Estimating sizes, distances, and quantities; or determining time, costs, resources, or materials needed to perform a work activity.
Work Context
- Face-to-Face Discussions — Remodeling professionals often spend time meeting with clients, discussing job details with other workers, and providing guidance to contractors and helpers.
- Wear Common Protective or Safety Equipment such as Safety Shoes, Glasses, Gloves, Hearing Protection, Hard Hats, or Life Jackets —This job frequently requires wearing common protective or safety equipment such as safety shoes, glasses, gloves, hard hats, or personal fall protection harnesses
- Spend Time Using Your Hands to Handle, Control, or Feel Objects, Tools, or Controls — This job require using your hands to handle, control, or feel objects, tools, or controls constantly on a daily basis.
- Exposed to Hazardous Equipment — Rarely does this job require exposure to hazardous equipment.
- Spend Time Standing — Professional remodelers are on their feet all day long most days and often working on ladders or scaffolding.
- Importance of Being Exact or Accurate —Being highly accurate is important in performing this job. Work is frequently performed cutting and fitting materials to within 1/16 inch.
- Outdoors, Exposed to Weather — Workers often are expected to work outdoors and can be exposed to all types of weather.
- Exposed to Contaminants — Professionals in the remodeling industry are not often exposed to high levels of contamination and pollutants. However they are frequently exposed to dust resultant of cutting materials and demolition. They may also be exposed to low levels of gases from common construction materials such as paint or adhesives.
- Physical Proximity — Occasionally this job require the worker to perform job tasks in close physical proximity to other people in instances such as a bathroom remodel or lifting large beams.
- Spend Time Bending or Twisting the Body — This job requires frequent bending or twisting of your body in order to maneuver materials through finished homes, on ladders and sometimes small spaces like attics and basements.
Work Styles
- Attention to Detail — Job requires being careful about detail and thorough in completing work tasks.
- Dependability — Job requires being reliable, responsible, and dependable, and fulfilling obligations.
- Initiative — Job requires a willingness to take on responsibilities and challenges.
- Cooperation — Job requires being pleasant with others on the job and displaying a good-natured, cooperative attitude.
- Integrity — Job requires being honest and ethical.
- Independence — Job requires developing one’s own ways of doing things, guiding oneself with little or no supervision, and depending on oneself to get things done.
- Leadership — Job requires a willingness to lead, take charge, and offer opinions and direction.
- Analytical Thinking — Job requires analyzing information and using logic to address work-related issues and problems.
- Concern for Others — Job requires being sensitive to others’ needs and feelings and being understanding and helpful on the job.
- Innovation — Job requires creativity and alternative thinking to develop new ideas for and answers to work-related problems.
Work Values
- Support — Occupations that satisfy this work value offer supportive management that stands behind employees. Corresponding needs are Company Policies, Supervision: Human Relations, and Supervision: Technical.
- Independence — Occupations that satisfy this work value allow employees to work on their own and make decisions. Corresponding needs are Creativity, Responsibility, and Autonomy.
- Achievement — Occupations that satisfy this work value are results-oriented and allow employees to use their strongest abilities, giving them a feeling of accomplishment. Corresponding needs are Ability Utilization and Achievement.
Performance Measures
Internal Key Performance Indicators (Sources: Internal data collections, and Post-Graduate Surveys)
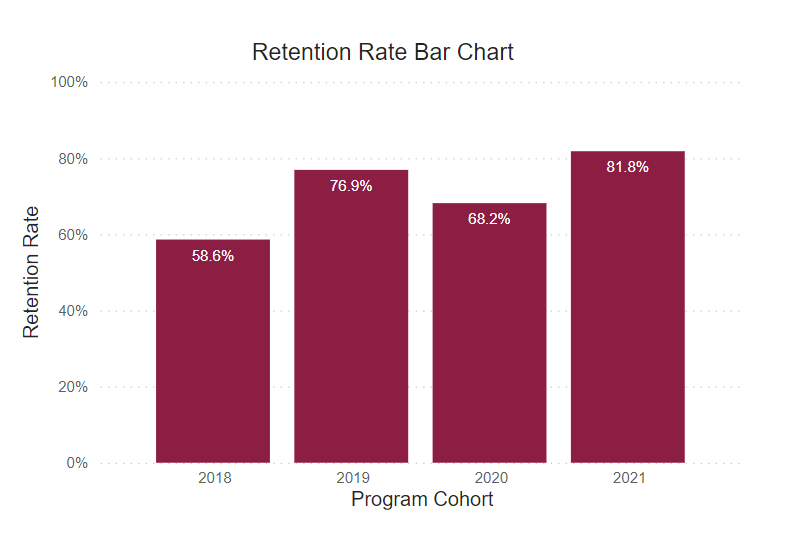
Retention Rate
This rate reflects the continuous term-to-term persistence rate for certificate programs and the fall-to-fall retention rate for associate degree programs.
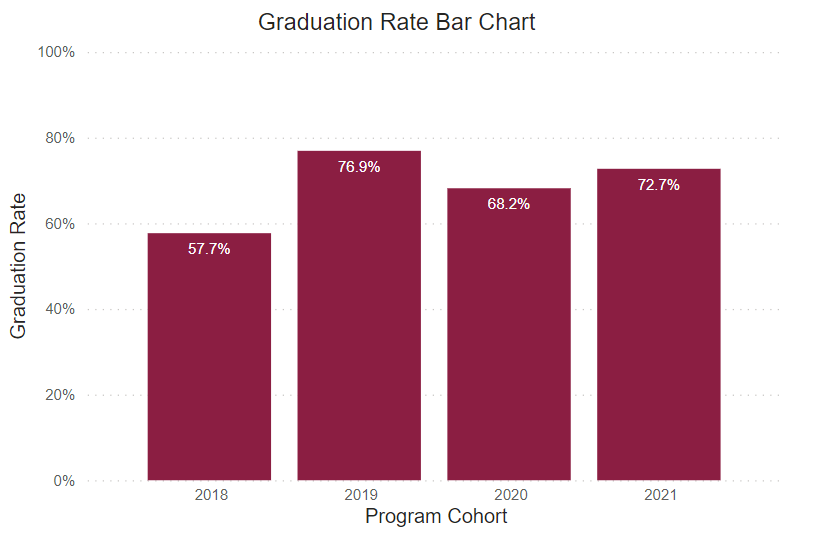
Graduation Rate
This rate reflects the number of freshmen who were officially enrolled in the fall semester and earned a certificate or degree within the expected timeframe.
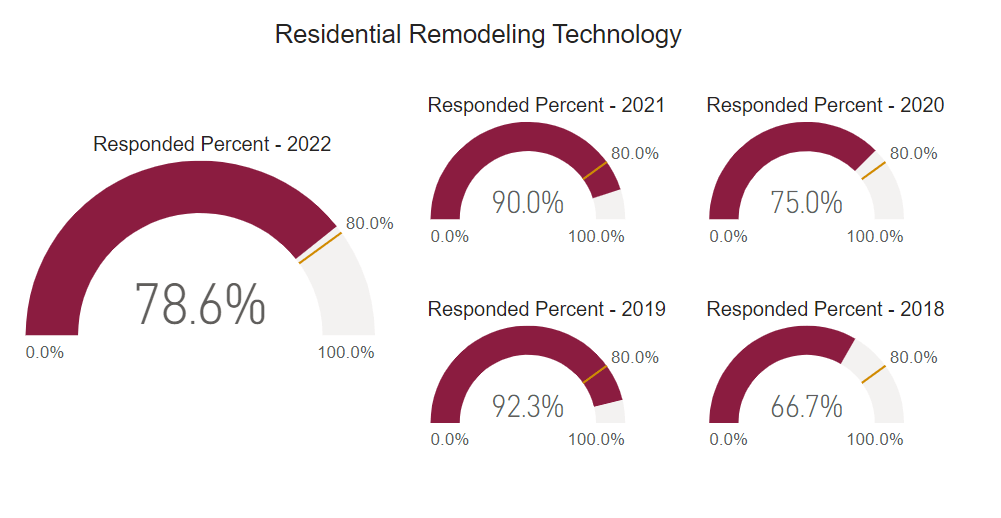
Post Graduate Survey Response Rate
The post graduate survey is an annual on-line post graduate survey utilized by the college to gather vital information regarding career placement, starting salary, and level of satisfaction.
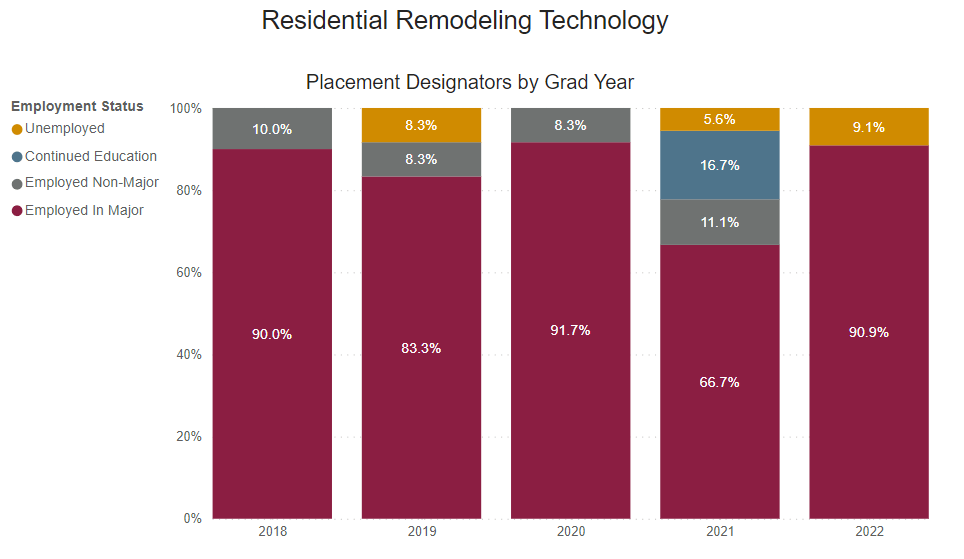
Employed Full Time Outside of Major
Percentage of graduates who reported being employed full-time outside their field of study.
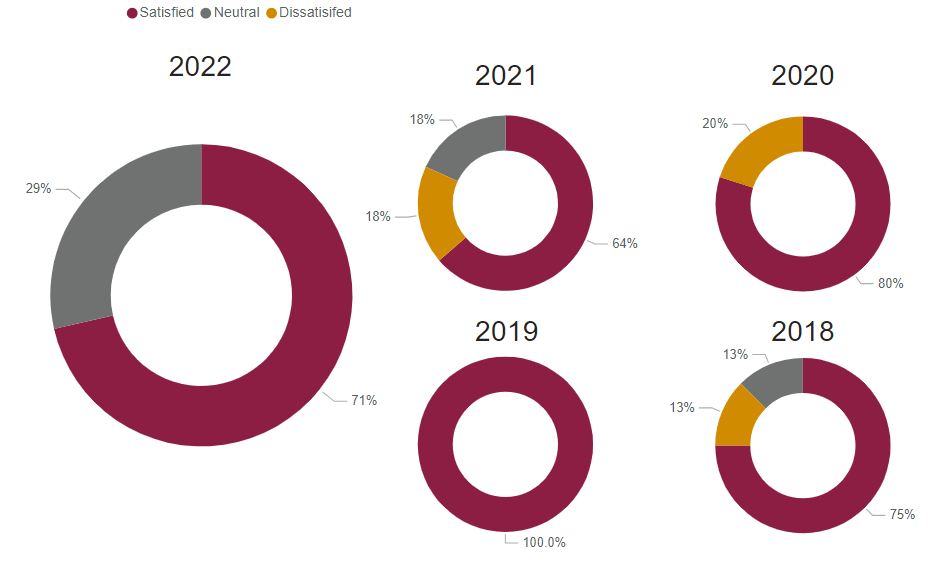
Graduate Satisfaction
This is the median graduate survey response evaluating the level of preparation for workforce entry (based on a 5-Item Likert Scale).
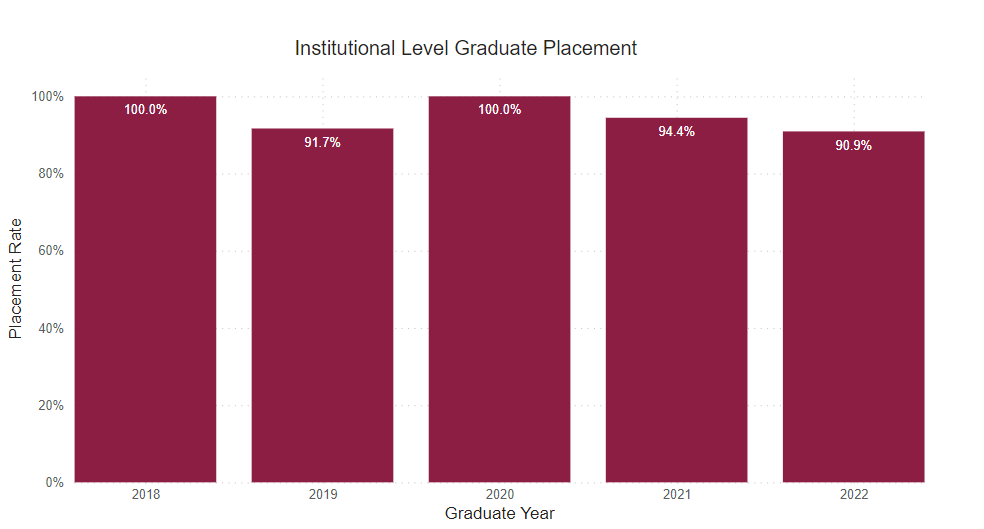
Placement Rate
This is the percent of graduate survey respondents who reported being employed or continued their education on a full-time basis.
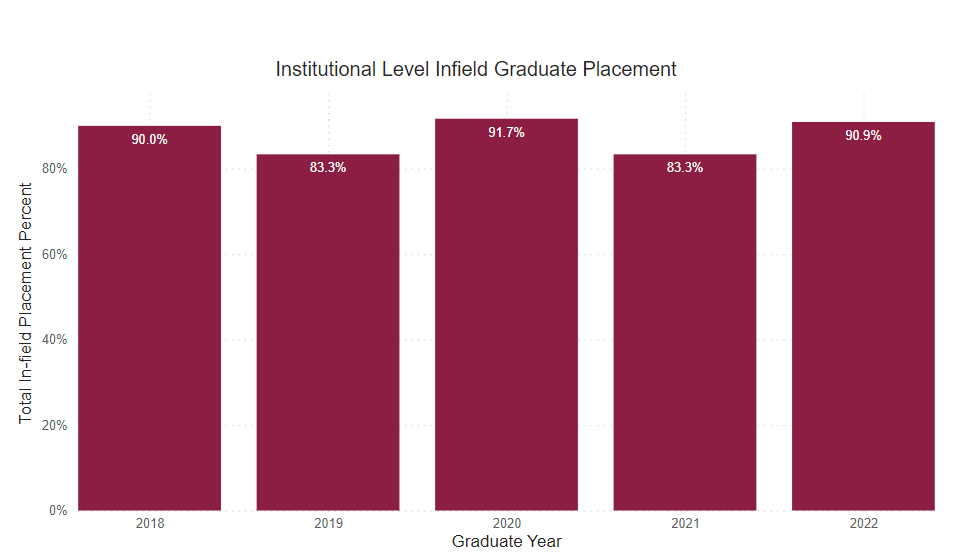
Employed Full Time Within Major
Percentage of graduates who reported being employed full-time within their field of study.
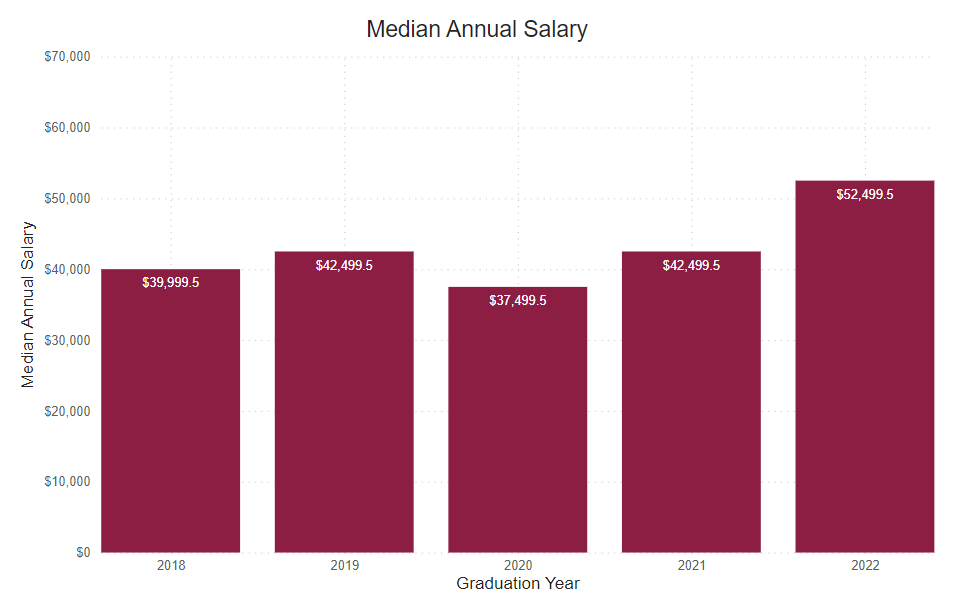
Annual Median Starting Salary
This number is based on the graduate survey response to the request to identify a starting salary from a range of options. This graph shows the median first-year annual salary. All calculations are based on the respondent’s self-reported first-year annual income.
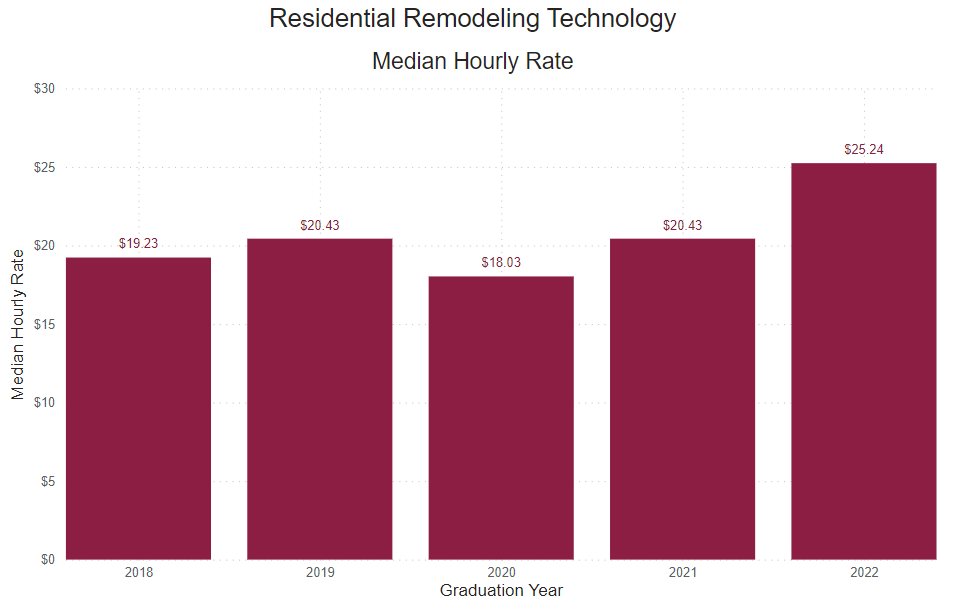
Reported Hourly Rate
This number is determined by dividing the reported median salary by the number of hours in a traditional full-time work week (40), then the number of weeks in a year (52).
Our graduates work with the industry’s best
