Water & Environmental Technology
Get started today
About Water & Environmental Technology
The Pennsylvania Department of Environmental Protection requires that operators of drinking water and wastewater treatment facilities are certified. Certification is obtained through a combination of exams and operating systems. The completion of an approved associate degree program significantly reduces the number of years of operating experience required for certification. Students in the Water and Environmental Technology program gain the knowledge, skills, and abilities necessary for successful completion of Department of Environmental Protection examinations.
Courses in the Water and Environmental Technology program are designed to meet the knowledge, skills, and ability requirements tested on the Pennsylvania Department of Environmental Protection certification exams. This will include courses covering topics such as water and wastewater treatment; water distribution and wastewater conveyance systems; geographical information systems (GIS); equipment maintenance; solids handling; basic electricity; plant administration; and rules and regulations.
What you’ll learn
- Describe the major processes, equipment, instrumentation, laws, and regulations associated with the collection and treatment of wastewater.
- Describe the major processes, equipment, instrumentation, laws, and regulations associated with the conveyance and treatment of potable water.
- Perform water and wastewater calculations involving flow, volume, surface area, disinfection, solids removal, retention time, and chemical feed rates.
- Analyze and improve operational
- Procedures at water treatment and wastewater treatment facilities.
- Prepare, analyze, interpret, and report results of water and wastewater sample testing.
- Maintain a safe working environment as outlined by federal and state regulations.
- Describe the Safe Water Drinking Act and its implementation.
- Identify and describe the common diseases associated with water supply and sewage.
- Demonstrate the monitoring duties of water treatment operators.
- Describe the areas of safety to be considered in water treatment, storage, and laboratory testing.
- Describe the operation, components, and troubleshooting procedures for motors and electrical circuits.
- Determine and employ optimization strategies for water treatment and wastewater treatment processes and treatment facilities.
Sample Job Titles
Operator, Water Treatment Plant Operator, Wastewater Operator, Waste Water Operator, Waste Water Treatment Plant Operator (WWTP Operator), Wastewater Treatment Plant Operator, Water Operator, Water Plant Operator, Process Operator, SCADA Operator (Supervisory Control and Data Acquisition Operator)
Quick facts
Location
Griscom Education Center, Fourth Floor
Type of program
Associate Degree
Job/Salary Outlook
See industry data
Length of program
2 years, 73 credits
Cost of program
$4,500/semester tuition
$3,000 – $3,500/semester housing
$1,850 – $2,335/semester meal plan
Tool List (PDF)
The outcomes speak for themselves
100%
employment
$57.5K
med. salary
100%
satisfaction
People of TSCT
Success stories

Program details
Courses
MODEL SCHEDULE FOR WATER AND ENVIRONMENTAL TECHNOLOGY TECHNOLOGY
Semester 1
- WET 102 Laboratory Skills (1 credit)
- WET 111 Drinking Water Distribution (3 credits)
- WET 116 Water Resources (4 credits)
- WET 156 Drinking Water I (4 credits)
- MATH 137 Intermediate Algebra (3 credits)
- ENG 106 English Composition (3 credits)
Semester 2
- WET 106 Wastewater Collection (3 credits)
- WET 121 Safety, Health, and Security (2 credits)
- WET 161 Waste Water I (4 credits)
- WET 168 Utility Management and Administration (3 credits)
- MATH ELECTIVE MATH 132 or MATH 150 (3 credits)
- CHEM 100 Conceptual Chemistry (or higher) (3 credits)
Semester 3
- WET 203 Stormwater Management (1 credit)
- WET 206 Wastewater II (5 credits)
- WET 211 Print Reading/GIS (3 credits)
- WET 216 Industrial Waste (3 credits)
- BIO 210 General Biology I (4 credits) (or environmental science or physics course)
- CIS 111 Intro to Computer Applications (3)
Semester 4
- WET 256 Drinking Water II (4 credits)
- WET 261 Advanced Waste Water and Solids Handling (4 credits)
- WET 268 Equipment and Systems Operations and Management (3 credits)
- ENG 216 Technical Writing (3 credits) OR ENG 221 Public Speaking (3 credits)
- Humanities Elective (3 credits)
Any Semester
- HEAL ELECTRIVE HEAL 106 or HEAL 111 (1 credit)
Total Credits 73
Faculty
Occupational Advisory Committee
The Occupational Advisory Committee (OAC) serves as a vital link between the Program of study and industry, ensuring that the program remains aligned with current workforce needs, technological advancements, and best practices in the field. Composed of employers, educators, and other community members, the committee provides guidance, feedback, and recommendations to enhance the curriculum, instructional methods, and student learning experiences.
Purpose and Responsibilities:
- Curriculum & Industry Alignment
- Workforce Readiness
- Student & Faculty Support
- Internship & Employment Connections
- Accreditation & Program Evaluation
- Facilities & Equipment Recommendations
By fostering a strong relationship between academia and industry, the OAC helps ensure that Thaddeus Stevens College programs maintain the highest standards in CTE (career and technical education).
- Joe Ardini, Mount Joy Borough Authority
- Art Auchenbach, Riordan Materials Corp.
- Kate Austin, City of Lancaster
- Tad Barnhart, Northern Lebanon County Authority
- Marci Beggs, Entech Engineering
- Susan Boyton, Pennsylvania Water Environment Association
- Michelle Braas, Xylem, Inc.
- Justin Brame, American Water
- Matthew Castel, Mifflin County Municipal Authority
- Jason Coyle, Arro Consulting Group
- George Cradic, American Water
- Doug Crawshaw, York Water
- Kent Croman, York Water
- Barb Culton, Klines Services
- Michael D’Agostino, Chester Water
- Tyler Davis, New Holland Borough
- Frank DiScuillo, Lebanon Authority
- John Farrier, Tyson Foods
- Leslie Ferguson, PA DEP
- Linda Ferich, Lancaster Conservancy
- Sam Getz, Manheim Area Water & Sewer Authority
- Allyson Gibson, Lancaster Clean Water Partners
- Taylor Gockley, Lancaster Area Sewer Authority
- Carol Herr, Lancaster Area Sewer Authority
- Walter Higgins, US EPA
- Kristen Koch, Penn State Agriculture & Environmental Center
- Matt Kofroth, Lancaster County Conservation District
- Kevin Kowalski, Butler Township Authority
- Michael Kyle, Lancaster Area Sewer Authority
- Nathan Laucks, Inframark LLC
- Olivia Leaman, The ARRO Group
- Dave Lewis, Columbia Water
- Kevin Little, Utz Quality Foods LLC
- Ed Lyle, Lancaster Area Sewer Authority
- Steve Main, Bell & Evans
- Steven McBryde, Chester Water Authority
- Kevin McGonigal, Susquehanna River Basin Commission
- Leslie McMullen, Millersville Borough
- Bill McNamara, PA DEP
- Ryan McNeil, Philadelphia Water Department
- Dean Miller, Miller Environmental
- Jenna Mitchell, Lancaster County Conservation District
- Tina Myers, New Holland Borough
- Bob Oakes, Borough of Lemoyne
- Brian Pasquale, Lancaster County Emergency Management
- Laura Perry, City of Lancaster
- Mikayla Regan, The ARRO Group
- Bill Rehkop, Derry Township Municipal Authority
- Jess Rosentel, Capital Region Water
- Brian Schreiber, Klines Services
- Fritz Schroeder, Lancaster County Conservancy
- Mike Skelly, Elizabethtown Area Water Authority
- Eric Sprunger, Bell and Evans
- Marykay Steinman, Estern PA Water Pollution Control Operators Association
- Deb Tobias, Manheim Area Water and Sewer Authority
- Christine Volkay-Hilditch, City of Lancaster
- Ira Walker Jr. Stewartstown Borough
- Stefan Weaver, Denali Water
- Michael Wolgemuth, Inframark LLC
Essential Skills Learned
Prepare detailed drawings of architectural and structural features of buildings or drawings and topographical relief maps used in civil engineering projects, such as highways, bridges, and public works. Use knowledge of building materials, engineering practices, and mathematics to complete drawings.
Tasks
- Add chemicals such as ammonia, chlorine, or lime to disinfect and deodorize water and other liquids.
- Inspect equipment or monitor operating conditions, meters, and gauges to determine load requirements and detect malfunctions.
- Collect and test water and sewage samples, using test equipment and color analysis standards.
- Record operational data, personnel attendance, or meter and gauge readings on specified forms.
- Operate and adjust controls on equipment to purify and clarify water, process or dispose of sewage, and generate power.
- Maintain, repair, and lubricate equipment, using hand tools and power tools.
- Clean and maintain tanks, filter beds, and other work areas using hand tools and power tools.
- Direct and coordinate plant workers engaged in routine operations and maintenance activities.
Tools used in this occupation
- Chlorine handling equipment — Dechlorination equipment; Disinfection chlorinators; Sulphonators
- Mixers or agitators — Aerators; Agitators; Flocculators
- Nitrogen or nitrate or nitrite analyzer — Ammonium analyzers; Nitrate analyzers
- Packaged water treatment systems — Anaerobic treatment equipment; Sequential batch reactors
- Ultrafiltration equipment — Backwash filters; Microstrainers; Trickling filter beds; Vacuum filters
Technology used in this occupation
- Compliance software — Material safety data sheet MSDS software
- Database user interface and query software — Data logging software; Database software
- Document management software — Records management software
- Industrial control software — Human-machine interface HMI software; Supervisory control and data acquisition SCADA software; Wastewater expert control systems
- Office suite software — Microsoft Office software
Knowledge
- Mathematics — Knowledge of arithmetic, algebra, geometry, calculus, statistics, and their applications.
- Mechanical — Knowledge of machines and tools, including their designs, uses, repair, and maintenance.
- Chemistry — Knowledge of the chemical composition, structure, and properties of substances and of the chemical processes and transformations that they undergo. This includes uses of chemicals and their interactions, danger signs, production techniques, and disposal methods.
- Public Safety and Security — Knowledge of relevant equipment, policies, procedures, and strategies to promote effective local, state, or national security operations for the protection of people, data, property, and institutions.
- Physics — Knowledge, and prediction of physical principles, laws, their interrelationships, and applications to understanding fluid, material, and atmospheric dynamics, and mechanical, electrical, atomic, and subatomic structures and processes.
- English Language — Knowledge of the structure and content of the English language including the meaning and spelling of words, rules of composition, and grammar.
- Production and Processing — Knowledge of raw materials, production processes, quality control, costs, and other techniques for maximizing the effective manufacture and distribution of goods.
- Biology — Knowledge of plant and animal organisms, their tissues, cells, functions, interdependencies, and interactions with each other and the environment.
- Customer and Personal Service — Knowledge of principles and processes for providing customer and personal services. This includes customer needs assessment, meeting quality standards for services, and evaluation of customer satisfaction.
- Education and Training — Knowledge of principles and methods for curriculum and training design, teaching and instruction for individuals and groups, and the measurement of training effects.
Skills
- Operation and Control — Controlling operations of equipment or systems.
- Operation Monitoring — Watching gauges, dials, or other indicators to make sure a machine is working properly.
- Monitoring — Monitoring/Assessing performance of yourself, other individuals, or organizations to make improvements or take corrective action.
- Quality Control Analysis — Conducting tests and inspections of products, services, or processes to evaluate quality or performance.
- Active Listening — Giving full attention to what other people are saying, taking time to understand the points being made, asking questions as appropriate, and not interrupting at inappropriate times.
- Equipment Maintenance — Performing routine maintenance on equipment and determining when and what kind of maintenance is needed.
- Reading Comprehension — Understanding written sentences and paragraphs in work-related documents.
- Troubleshooting — Determining causes of operating errors and deciding what to do about it.
- Critical Thinking — Using logic and reasoning to identify the strengths and weaknesses of alternative solutions, conclusions, or approaches to problems.
- Repairing — Repairing machines or systems using the needed tools.
Abilities
- Oral Expression — The ability to communicate information and ideas in speaking so others will understand.
- Near Vision — The ability to see details at close range (within a few feet of the observer).
- Oral Comprehension — The ability to listen to and understand information and ideas presented through spoken words and sentences.
- Written Comprehension — The ability to read and understand information and ideas presented in writing.
- Deductive Reasoning — The ability to apply general rules to specific problems to produce answers that make sense.
- Inductive Reasoning — The ability to combine pieces of information to form general rules or conclusions (includes finding a relationship among seemingly unrelated events).
- Perceptual Speed — The ability to quickly and accurately compare similarities and differences among sets of letters, numbers, objects, pictures, or patterns. The things to be compared may be presented at the same time or one after the other. This ability also includes comparing a presented object with a remembered object.
- Problem Sensitivity — The ability to tell when something is wrong or is likely to go wrong. It does not involve solving the problem, only recognizing there is a problem.
- Speech Clarity — The ability to speak clearly so others can understand you.
- Written Expression — The ability to communicate information and ideas in writing so others will understand.
Work Activities
- Evaluating Information to Determine Compliance with Standards — Using relevant information and individual judgment to determine whether events or processes comply with laws, regulations, or standards.
- Monitor Processes, Materials, or Surroundings — Monitoring and reviewing information from materials, events, or the environment, to detect or assess problems.
- Identifying Objects, Actions, and Events — Identifying information by categorizing, estimating, recognizing differences or similarities, and detecting changes in circumstances or events.
- Getting Information — Observing, receiving, and otherwise obtaining information from all relevant sources.
- Inspecting Equipment, Structures, or Material — Inspecting equipment, structures, or materials to identify the cause of errors or other problems or defects.
- Documenting/Recording Information — Entering, transcribing, recording, storing, or maintaining information in written or electronic/magnetic form.
- Making Decisions and Solving Problems — Analyzing information and evaluating results to choose the best solution and solve problems.
- Controlling Machines and Processes — Using either control mechanisms or direct physical activity to operate machines or processes (not including computers or vehicles).
- Processing Information — Compiling, coding, categorizing, calculating, tabulating, auditing, or verifying information or data.
- Communicating with Supervisors, Peers, or Subordinates — Providing information to supervisors, co-workers, and subordinates by telephone, in written form, e-mail, or in person.
Work Context
- Face-to-Face Discussions — 81% responded “Every day.”
- Structured versus Unstructured Work — 62% responded “A lot of freedom.”
- Telephone — 59% responded “Every day.”
- Wear Common Protective or Safety Equipment such as Safety Shoes, Glasses, Gloves, Hearing Protection, Hard Hats, or Life Jackets — 66% responded “Every day.”
- Exposed to Contaminants — 63% responded “Every day.”
- Freedom to Make Decisions — 59% responded “A lot of freedom.”
- Exposed to Hazardous Conditions — 68% responded “Every day.”
- Importance of Being Exact or Accurate — 65% responded “Very important.”
- Indoors, Environmentally Controlled — 72% responded “Every day.”
- Sounds, Noise Levels Are Distracting or Uncomfortable — 59% responded “Every day.”
- Indoors, Not Environmentally Controlled — 47% responded “Every day.”
- Consequence of Error — 50% responded “Extremely serious.”
- Contact With Others — 45% responded “Constant contact with others.”
Interests
- Realistic — Realistic occupations frequently involve work activities that include practical, hands-on problems, and solutions. They often deal with plants, animals, and real-world materials like wood, tools, and machinery. Many of the occupations require working outside and do not involve a lot of paperwork or working closely with others.
- Conventional — Conventional occupations frequently involve following set procedures and routines. These occupations can include working with data and details more than with ideas. Usually, there is a clear line of authority to follow.
Work Styles
- Adaptability/Flexibility — Job requires being open to change (positive or negative) and to considerable variety in the workplace.
- Attention to Detail — Job requires being careful about detail and thorough in completing work tasks.
- Dependability — Job requires being reliable, responsible, and dependable, and fulfilling obligations.
- Integrity — Job requires being honest and ethical.
- Independence — Job requires developing one’s own ways of doing things, guiding oneself with little or no supervision, and depending on oneself to get things done.
- Stress Tolerance — Job requires accepting criticism and dealing calmly and effectively with high-stress situations.
- Analytical Thinking — Job requires analyzing information and using logic to address work-related issues and problems.
- Initiative — Job requires a willingness to take on responsibilities and challenges.
- Cooperation — Job requires being pleasant with others on the job and displaying a good-natured, cooperative attitude.
- Self-Control — Job requires maintaining composure, keeping emotions in check, controlling anger, and avoiding aggressive behavior, even in very difficult situations.
Work Values
- Support — Occupations that satisfy this work value offer supportive management that stands behind employees. Corresponding needs are Company Policies, Supervision: Human Relations, and Supervision: Technical.
- Independence — Occupations that satisfy this work value allow employees to work on their own and make decisions. Corresponding needs are Creativity, Responsibility, and Autonomy.
- Achievement — Occupations that satisfy this work value are results-oriented and allow employees to use their strongest abilities, giving them a feeling of accomplishment. Corresponding needs are Ability Utilization and Achievement.
Performance Measures
Internal Key Performance Indicators (Sources: Internal data collections, and Post-Graduate Surveys)
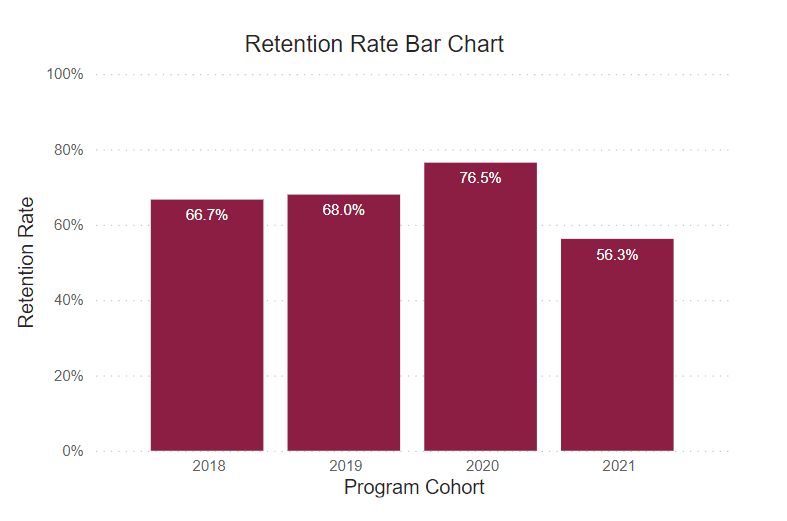
Retention Rate
This rate reflects the continuous term-to-term persistence rate for certificate programs and the fall-to-fall retention rate for associate degree programs.
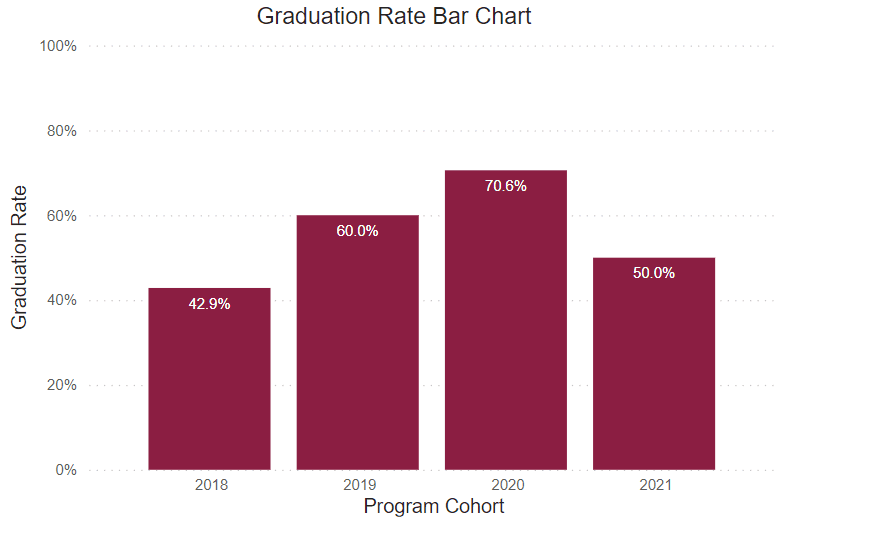
Graduation Rate
This rate reflects the number of freshmen who were officially enrolled in the fall semester and earned a certificate or degree within the expected timeframe.
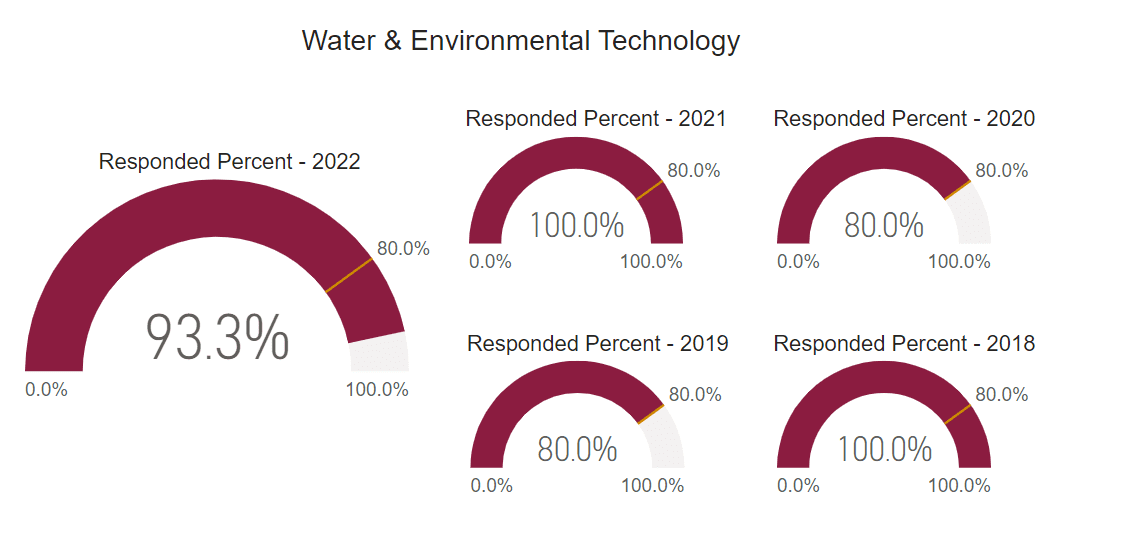
Post Graduate Survey Response Rate
The post graduate survey is an annual on-line post graduate survey utilized by the college to gather vital information regarding career placement, starting salary, and level of satisfaction.
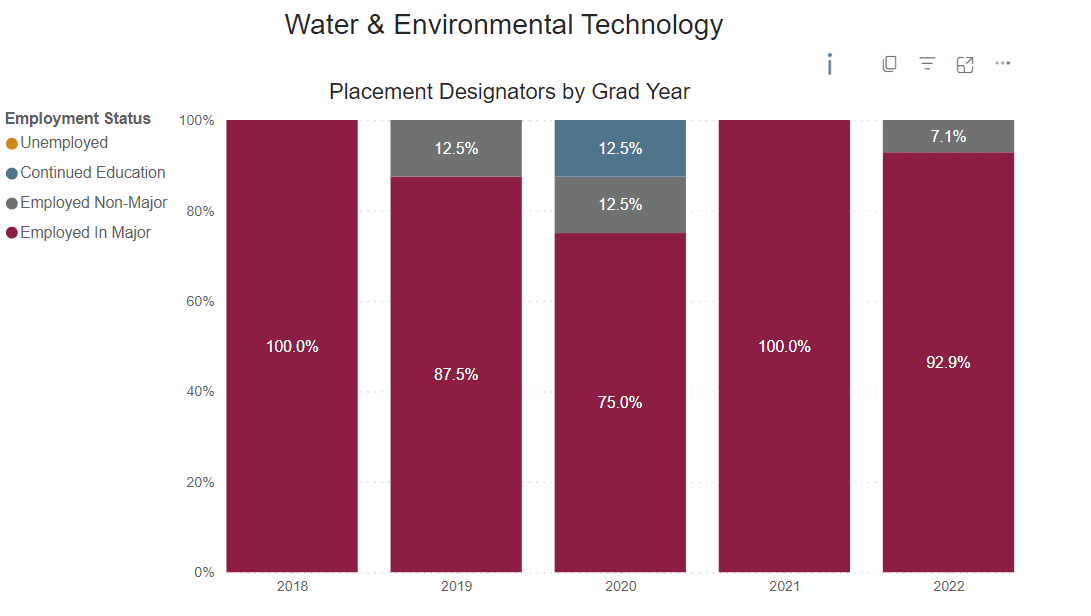
Employed Full Time Outside of Major
Percentage of graduates who reported being employed full-time outside their field of study.
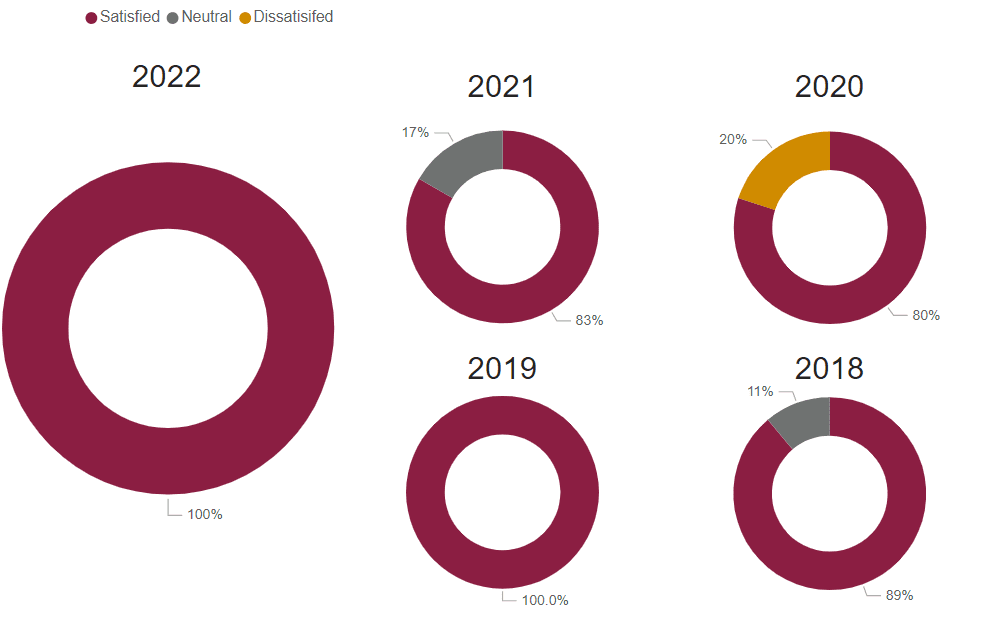
Graduate Satisfaction
This is the median graduate survey response evaluating the level of preparation for workforce entry (based on a 5-Item Likert Scale).

Placement Rate
This is the percent of graduate survey respondents who reported being employed or continued their education on a full-time basis.
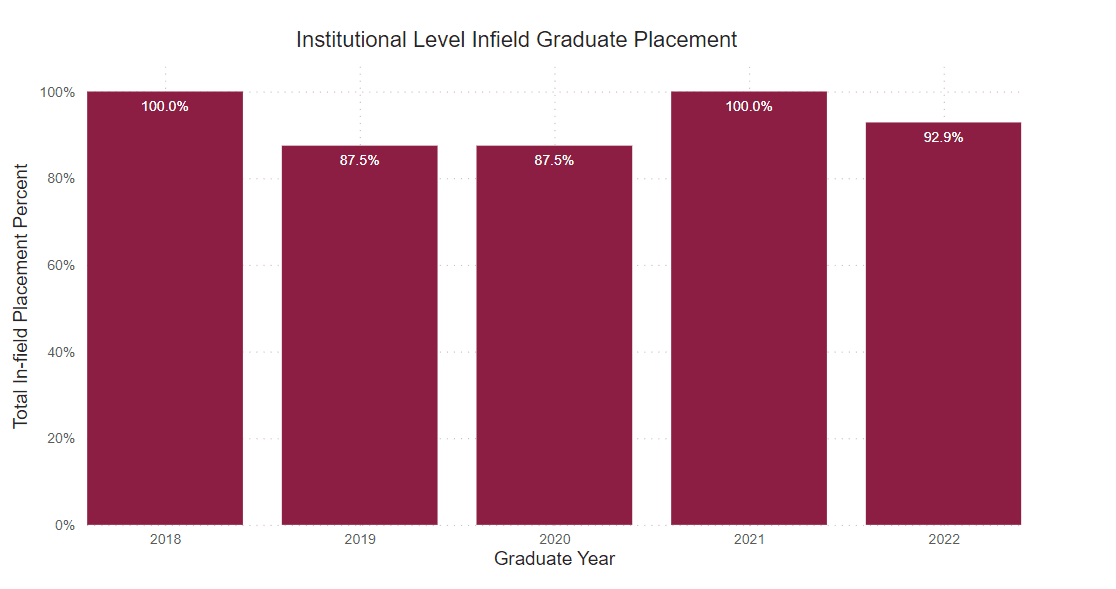
Employed Full Time Within Major
Percentage of graduates who reported being employed full-time within their field of study.
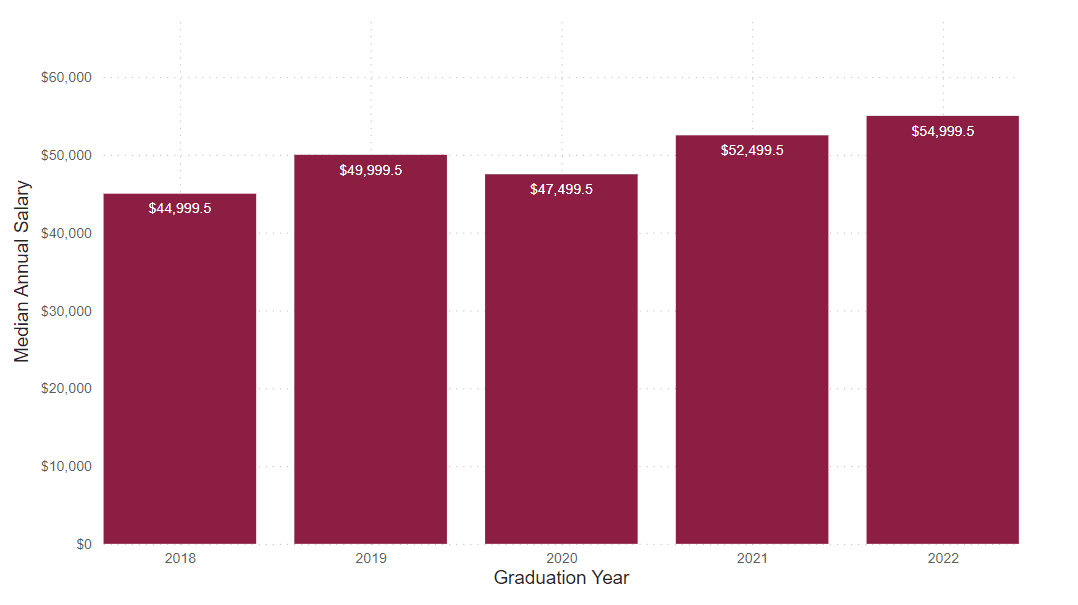
Annual Median Starting Salary
This number is based on the graduate survey response to the request to identify a starting salary from a range of options. This graph shows the median first-year annual salary. All calculations are based on the respondent’s self-reported first-year annual income.
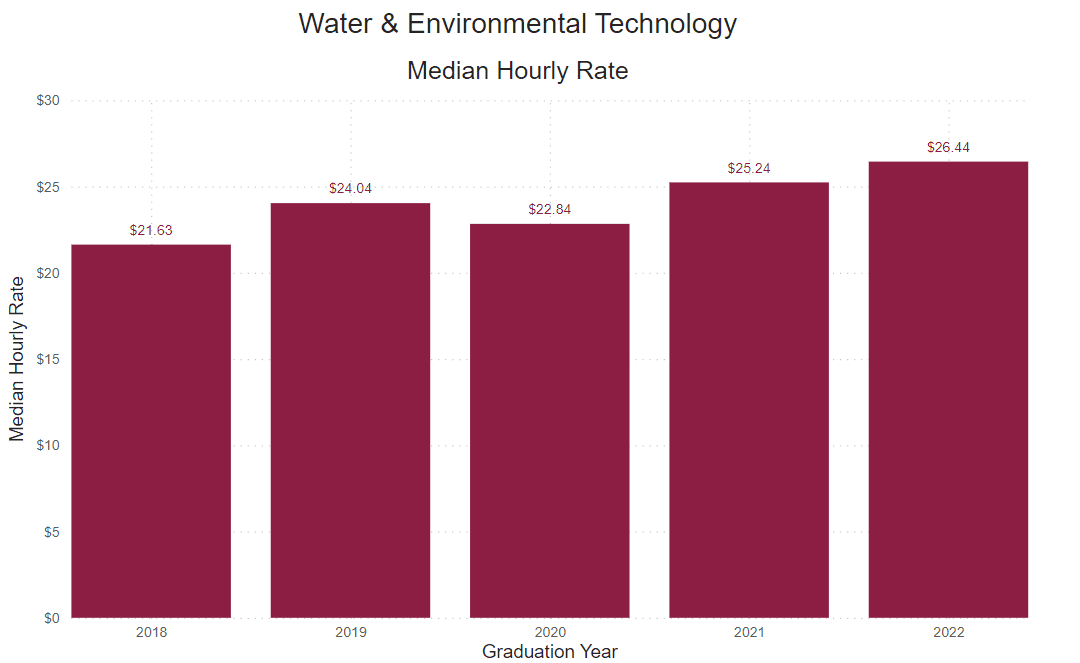
Reported Hourly Rate
This number is determined by dividing the reported median salary by the number of hours in a traditional full-time work week (40), then the number of weeks in a year (52).

Our graduates work with the industry’s best


